Post-Covid Travel Patterns and Solutions

FK4

Senior Member
Joined
Nov 13, 2012
Messages
3,141
Reaction score
1,313
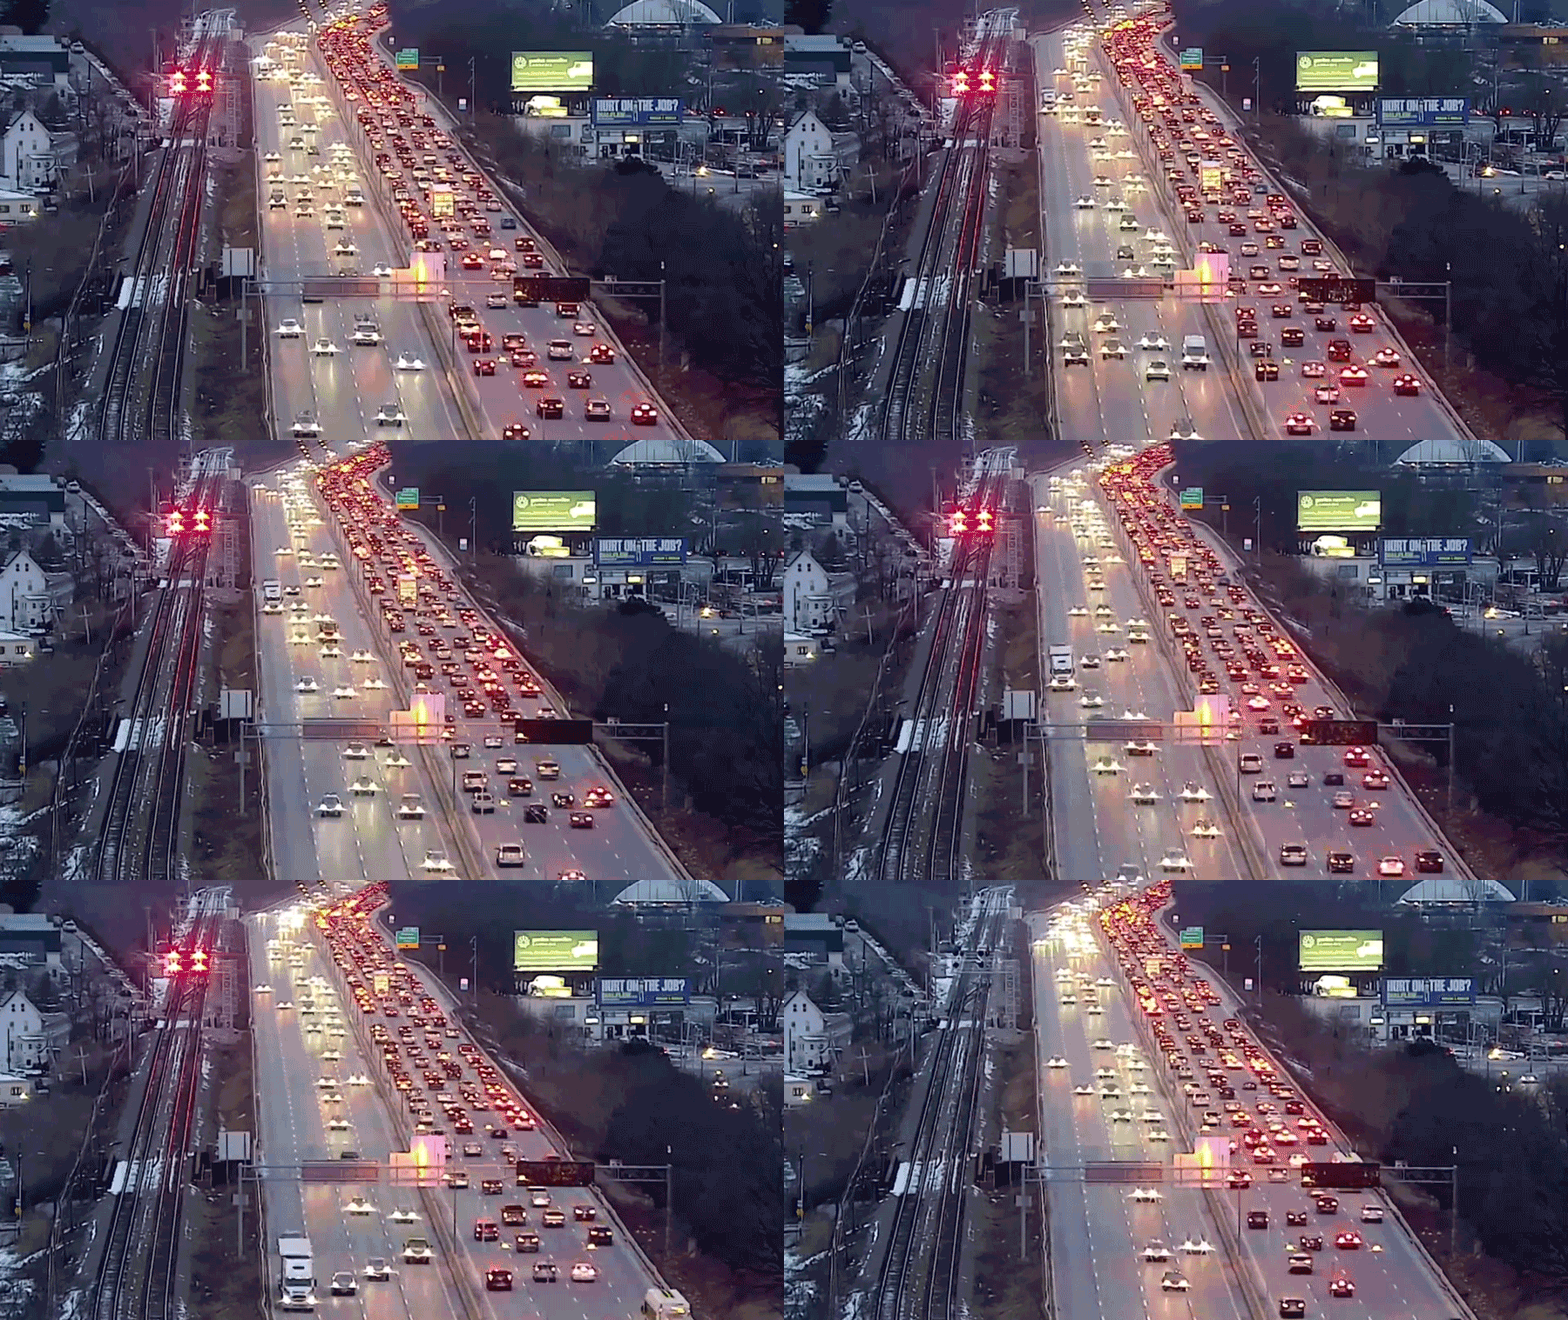
This thread asks: what has changed in travel and commuting patterns pre- to post-pandemic? Ridership remains 60-70% what it was pre-Covid, and yet at the same time, traffic all across the city is worse than it's ever been. Why is this? I haven't really seen any satisfactory analyses of either problem. It's been long enough that there should be at least some early research and data on what commuter patterns and work patterns are going to look like in the future, and what impact WFH will have. What do we know at this point? But, what I really have not seen any good analyses on is: why is the traffic so bad? The only stories I've seen on this issue blame low-hanging fruit like the dysfunction of the T, but I'm not buying it. Surely, there is more to it than that... especially since the Commuter Rail has suffered far less than the subways have, so that should not explain the 30-40% drop in ridership if the number of cars has increased—even if we account for the fact that many CR riders change to a subway upon arrival at terminus.

Anyway, I would like to see this thread be a place be a place where people can share info and centers that are researching these issues, and opinions on why things are the way they are, and where they are going. I know there's another thread about the "crisis" in ridership but this is more broad, focusing on what is happening in the travel patterns today and how and why it differs from 2019 and before.
 
MBTA after this man's leadership

giphy.webp
 
This thread asks: what has changed in travel and commuting patterns pre- to post-pandemic? Ridership remains 60-70% what it was pre-Covid, and yet at the same time, traffic all across the city is worse than it's ever been. Why is this?
But, what I really have not seen any good analyses on is: why is the traffic so bad? The only stories I've seen on this issue blame low-hanging fruit like the dysfunction of the T, but I'm not buying it.
you'll have to start by 'proving' this. From actual traffic count data volume, peak hours are near where they were but it then tails off much more rapidly than pre covid (ie, a 4 hour count volume is less now than it was before). also count wise, the PM peak hour occurs earlier now that it used to.

anecdotally I would disagree. Mondays and Fridays are way better than they used to be. and even T, W, Th arent always as bad but can certainly be bad (eg, I went from downtown to Dorchester last night at 5 PM and it took 40 minutes. That was worse than I expected. pre covid that would have been about normal and it could have been far worse).

Id genuinely love to hear of anecdotal stories where it is worse. would love to see if there is a pattern of areas or roadway types where it is happening.

There are locations where traffic count is down from pre-COVID and locations where traffic count is up from pre-COVID. For example, according to MassDOT traffic count data, volume was up 12% on the Tobin Bridge from 12/2019 to 12/2023, which was the ninth consecutive month that saw traffic counts higher than pre-COVID. This data is especially fascinating given that in 2019 there was no bus lane lane on the Tobin Bridge.

1705597743900.png


This data is presented without making any claims for travel patterns outside of this study area.
 
There are locations where traffic count is down from pre-COVID and locations where traffic count is up from pre-COVID. For example, according to MassDOT traffic count data, volume was up 12% on the Tobin Bridge from 12/2019 to 12/2023, which was the ninth consecutive month that saw traffic counts higher than pre-COVID. This data is especially fascinating given that in 2019 there was no bus lane lane on the Tobin Bridge.

View attachment 46890

This data is presented without making any claims for travel patterns outside of this study area.
I would be cautions of Tobin data as an indicator. In the past 2 years there have been numerous and long shutdowns of the Sumner Tunnel. Lots of North Shore traffic has diverted to the Tobin. And in some cases the new pattern has stuck, even with the tunnel open. (Note the July and August 2023 Tobin peak, during the July/August Sumner shutdown).
 
in 2019 they were replacing the viaduct in Chelsea I believe.
Either way, you have to be careful using daily traffic volumes and equating that to 'traffic is worse'. adding volumes at off peak times will give you higher ADT, it doesnt make traffic worse, necessarily.
 
There are locations where traffic count is down from pre-COVID and locations where traffic count is up from pre-COVID. For example, according to MassDOT traffic count data, volume was up 12% on the Tobin Bridge from 12/2019 to 12/2023, which was the ninth consecutive month that saw traffic counts higher than pre-COVID. This data is especially fascinating given that in 2019 there was no bus lane lane on the Tobin Bridge.

View attachment 46890

This data is presented without making any claims for travel patterns outside of this study area.
In 2019-2020 the bus lane was closed for construction.
 
Id genuinely love to hear of anecdotal stories where it is worse. would love to see if there is a pattern of areas or roadway types where it is happening.

South Coast (Dartmouth area) to Camberville, and vice versa, always sucked. During peak COVID it was (duh) much less sucky. Now it is way suckier.

Used to range between 1hr 15 min(ish) to 2.5hr on the route I take, pre-COVID; Now it's more like 1.5hr to 3.25hr.
 
anecdotally I would disagree. Mondays and Fridays are way better than they used to be. and even T, W, Th arent always as bad but can certainly be bad (eg, I went from downtown to Dorchester last night at 5 PM and it took 40 minutes. That was worse than I expected. pre covid that would have been about normal and it could have been far worse).
This is backed up by the state highway administrator


At the same time though highway traffic’s peak loads are basically back to pre-pandemic volumes.
This thread asks: what has changed in travel and commuting patterns pre- to post-pandemic? Ridership remains 60-70% what it was pre-Covid, and yet at the same time, traffic all across the city is worse than it's ever been. Why is this? I haven't really seen any satisfactory analyses of either problem. It's been long enough that there should be at least some early research and data on what commuter patterns and work patterns are going to look like in the future, and what impact WFH will have. What do we know at this point? But, what I really have not seen any good analyses on is: why is the traffic so bad? The only stories I've seen on this issue blame low-hanging fruit like the dysfunction of the T, but I'm not buying it. Surely, there is more to it than that... especially since the Commuter Rail has suffered far less than the subways have, so that should not explain the 30-40% drop in ridership if the number of cars has increased—even if we account for the fact that many CR riders change to a subway upon arrival at terminus.
What I believe to be the primary driver behind the lower transit ridership but recovered car traffic is not complete WFH but partial WFH. Before with everyone who wasn’t full-time work from home having to come into the office every day, that traffic filled slog gets incredibly draining making transit much more enticing. Now that a lot of offices has transitioned to 3/4 days a week in-office, a lot of commuters find sitting in traffic and parking fees more bearable for the flexibility and comfort of their car. This also feeds into the commuter rail’s high recovery. CR schedules have shifted to a more all-day clock face regional rail format that has made it more flexible to the occasional commuter that either comes in odd hours, doesn’t mind the cost, or simply doesn’t want to deal with traffic for a few days a week or less.
The Census ACS data also shows that Driving Alone commuting has dropped slightly more than public transit (4% vs 3%).
IMG_4636.jpeg
 
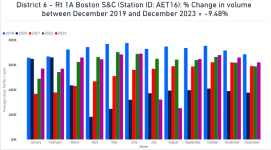
In case anybody is interested in the data for average daily traffic counts at the four locations closest to Downtown Boston that MassDot publishes data for:

Count Location​
% Change in Volume Between December 2019 and December 2023​
Ted Williams Tunnel-3.34%
Mass Pike at Fenway-11.83%
Tobin Bridge+11.86%
Sumner & Callahan-9.48%
1705611705668.png


1705611469466.png


1705611502656.png


1705611529753.png

I am not claiming anything beyond the data that I'm presenting for discussion. This is not me saying that this data is representative or that rush hour traffic is worse. I am simply presenting some of the best data we have on the topic for discussion.

As I said before, there are locations where traffic count is down from pre-COVID and locations where traffic count is up from pre-COVID. I hope you all enjoy the data and the pretty graphs.
 

Attachments

  • 1705611404576.png
    1705611404576.png
    28.8 KB · Views: 32
Last edited:
In case anybody is interested in the data for average daily traffic counts at the four locations closest to Downtown Boston that MassDot publishes data for:

Count Location​
% Change in Volume Between December 2019 and December 2023​
Ted Williams Tunnel-3.34%
Mass Pike at Fenway-11.83%
Tobin Bridge+11.86%
Sumner & Callahan-9.48%

I am not claiming anything beyond the data that I'm presenting for discussion. This is not me saying that this data is representative or that rush hour traffic is worse. I am simply presenting some of the best data we have on the topic for discussion.

As I said before, there are locations where traffic count is down from pre-COVID and locations where traffic count is up from pre-COVID. I hope you all enjoy the data and the pretty graphs.

Just to add one more data point to this, because it captures the pike and those coming from the north but misses those of us coming from the south:

I-93 NB just south of exit 16 (still labeled as just exit 20 in the dashboard lol): -7.92%

My anecdotal contribution, the organization I work for is based downtown and has settled into a permanent 2 days in the office 3 days at home. Though most of our office is T takers. Interesting note on that is we're doing our part towards decreased ridership, but the office still pays for full $90 monthly passes for us, so they aren't losing revenue from us.
 
Quick note: While the discussion has thus far focused on automobiles, if anyone wants to look at the question from a transit perspective, I would caution against using MBTA ridership data at face level.

I previously compared 2019 ridership data to 2023 (though there was a bug in the data and the 2023 data only runs until October, so I'll need to redo the analysis in the future). A key finding was that transit ridership recovery has strong correlation with levels of service, and in particular, slow zones. The Red and Orange lines which suffered the worst speed restrictions also had the worst recovery, especially on the RL branches where the headways also became commuter rail-like. (The fact that Quincy Center's ridership recovery rate is indistinguishable from Braintree means there's a real drop from urban, built-up areas, and not just suburban P&R commuters.)
 
Last edited:
South Coast (Dartmouth area) to Camberville, and vice versa, always sucked. During peak COVID it was (duh) much less sucky. Now it is way suckier.

Used to range between 1hr 15 min(ish) to 2.5hr on the route I take, pre-COVID; Now it's more like 1.5hr to 3.25hr.
Is it consistently specific areas causing the extra time?
 
  • Like
Reactions: FK4
I was prompted to post this after reading mentions of increased traffic beyond pre Covid levels in this transit matters report: https://static1.squarespace.com/sta...Modernizing+the+Framingham+Worcester+Line.pdf (not cited tho)

They did not cite sources, but I've read a seeming endless series of articles about the same thing in various news media.

My anecdotal evidence is from my own commute and the experiences of pretty much everyone I know, all of whom live and work within the City of Boston. So the phenomenon I am describing is the city, not the region. My own commute is usually odd hours, but same location for 11 years. The afternoon commute has increased by 5-10 minutes for a 7 mile distance, this is not in my head. Overall, my experience is that most of the city is choked by traffic starting in the early afternoon, that is far worse than it was in the past. I dont have to commute often in the morning, but it also has been longer for me at least on my route, but the change is not as prominent as the afternoon situation. I hardly ever use the highways so cant really speak to that. It does seem that within Boston, though, that as someone posted above, PM rush hour starts earlier, but also ends earlier... things are not as bad at 6:30, eg, as they used to be. It also seems like Brookline's rush hour traffic is less severe than it was, which is interesting. Perhaps reflective of rich people WFH more.

My guess is there are many factors, but I am curious about some more granular research which someone must be doing on this, beyond just car counters on highways. @Koopzilla24 the article you shared lines up with my experience since I usually only head into town on Tu-We-Th, so cant speak to Monday or Friday. So perhaps things have just been squashed into the middle of the week. Tuesday and Wednesday along my commute is way worse than Thursday, from what I've noticed. It makes sense to me also that perhaps the agony of driving is more bearable if people are partially WFH. Likely, the increase in food delivery and Amazon trucks has added to this, but hard to know by how much, might be minimal (although, especially within the city, if we include the double parking by delivery vehicles, that's a factor that must be accounted for in contributing to back ups that would not be reflected simply by counting # trucks on the road).

Anyway, I think what I am most interested in is the question of what is the future going to look like in terms of travel patterns? Figuring this out now obviously has vast implications for transit needs of the near future.
 
the xpressway is the extra 25 to 45 minutes?
Construction on 140 and 24 hasn't helped, but 93 -- which, again, has (of course, yes) *always* been bad -- seems to have gotten worse in between N. Station and the Quincy exits than it had been pre-COVID.
 

Back
Top