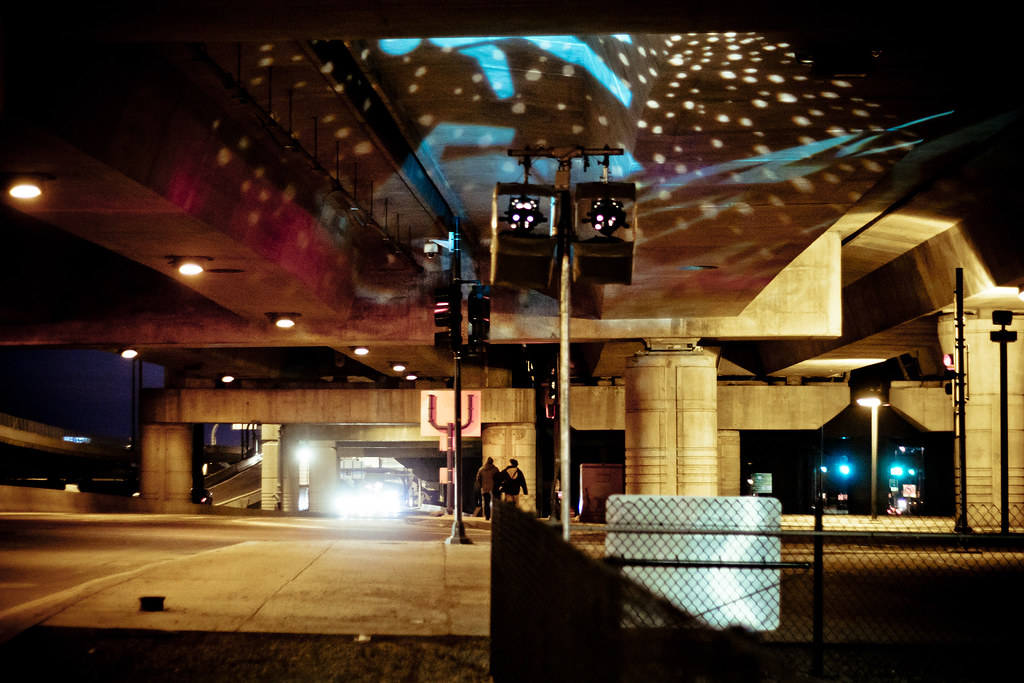
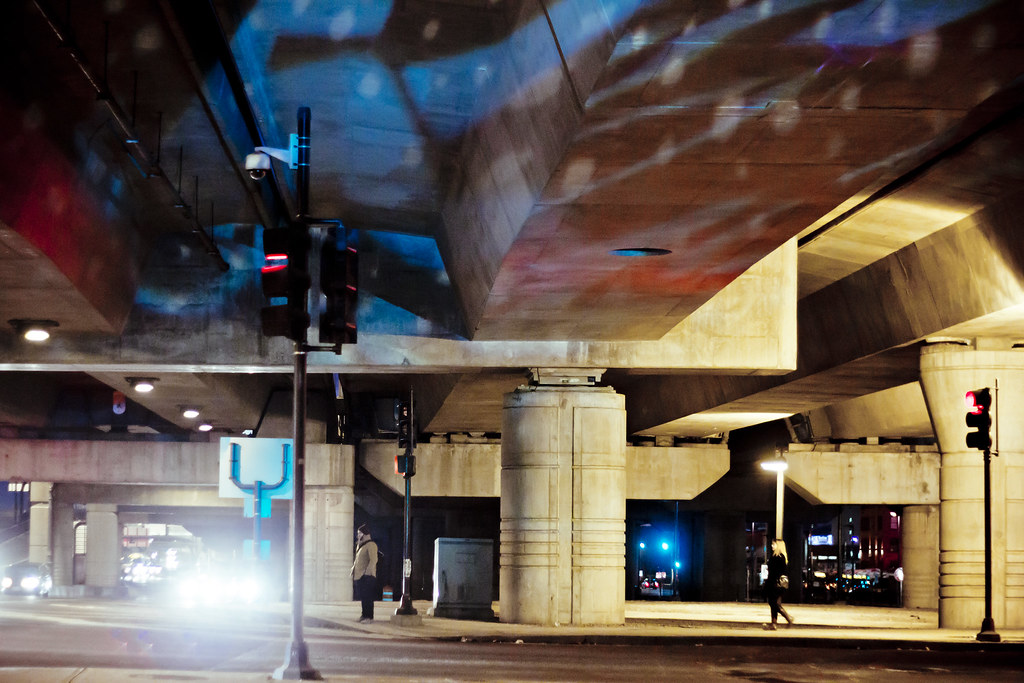
Does anyone have the usage statistics on the McGrath vs the section of Comm Ave they just rebuilt through BU?
http://mhd.ms2soft.com/tcds/tsearch.asp?loc=Mhd&mod=
Go nuts.
Here's what I pulled up: in 2010, Comm Ave adjacent to BU West counted 35,930 vehicles per day (both ways). In 2011, McGrath Highway near BET counted 32,478 vehicles per day (both ways). This is AADT, which is a value adjusted according to some seasonal factors, according to the site.
Other data points of interest:
Comm Ave by BU West: 36,900 (in 2005)
McGrath Highway by BET: 44,670 (in 1997)
Mass Ave by Symphony: 32,133 (in 2010); 33,000 (in 2005)
Cambridge St in Allston over the Pike: 37,797 (in 2010); 40,000 (in 2002)
Comm Ave just past Packard's Corner: 11,880 (in 2010); 12,200 (in 2005)
Comm Ave in Kenmore Square: 25,998 (in 2010); 26,700 (in 2005)
Longfellow Bridge: 21,500 (in 2010); 28,400 (in 2000).


