stick n move
Superstar
- Joined
- Oct 14, 2009
- Messages
- 12,148
- Reaction score
- 19,081
That reminds me of how density maps of los angeles are skewed low because all the mountains around that have no housing whatsoever bring the overall density down of LA county making it seem less dense than it reallly is. I can imagine the airport has a huge effect on east boston.

 IMG_7662
 IMG_7663
 IMG_7665
 IMG_7536
 IMG_7561
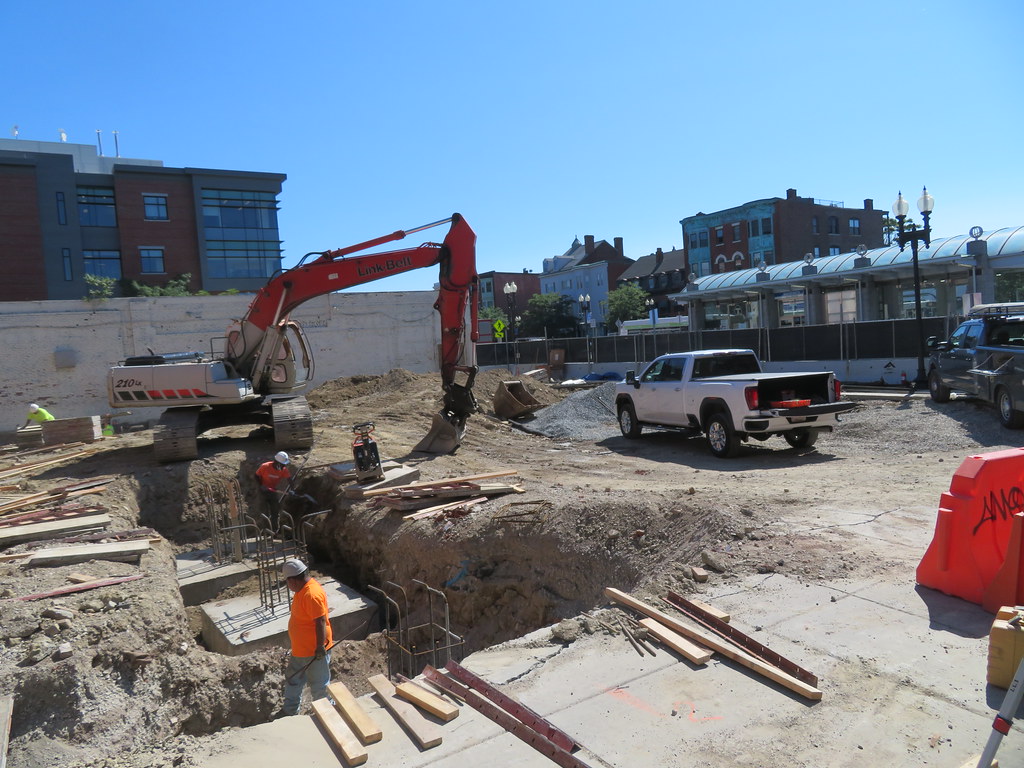 IMG_7563
 IMG_7564
 IMG_7565
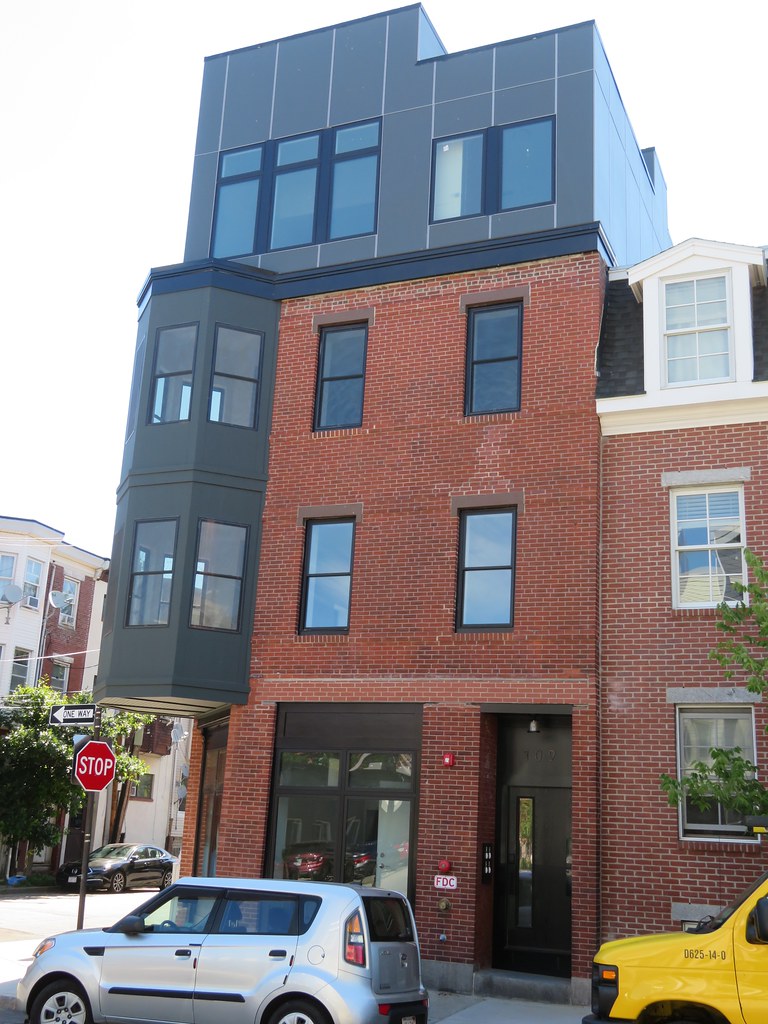 IMG_7582
 IMG_7583
 IMG_7586
 IMG_7587
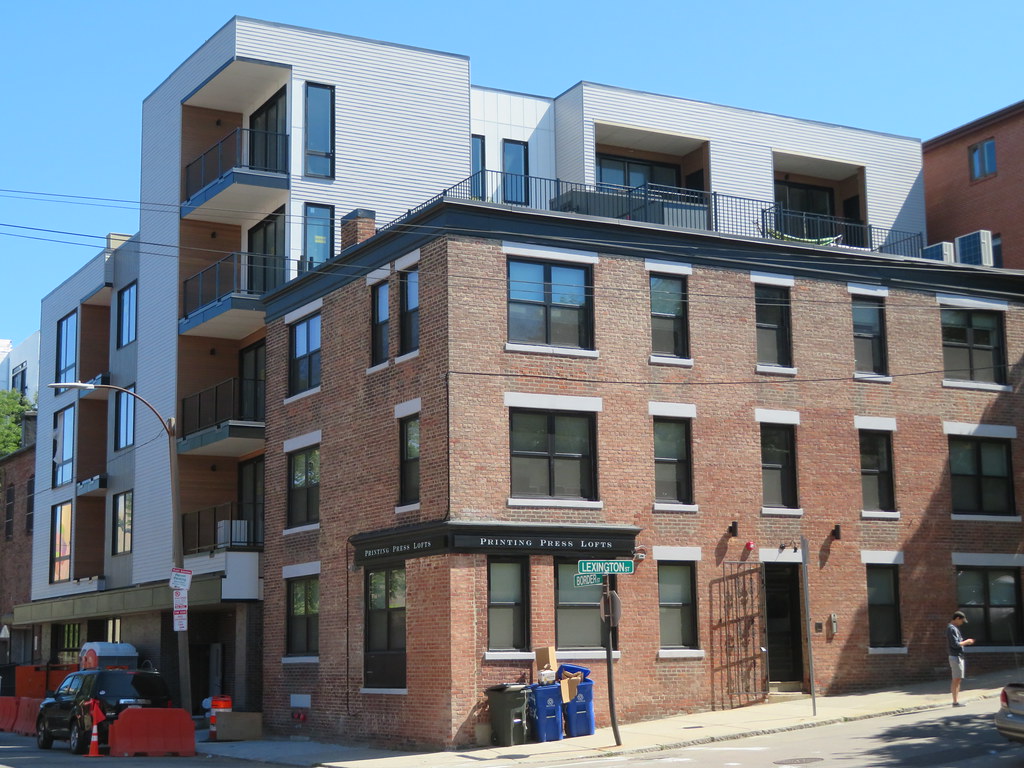 IMG_7591
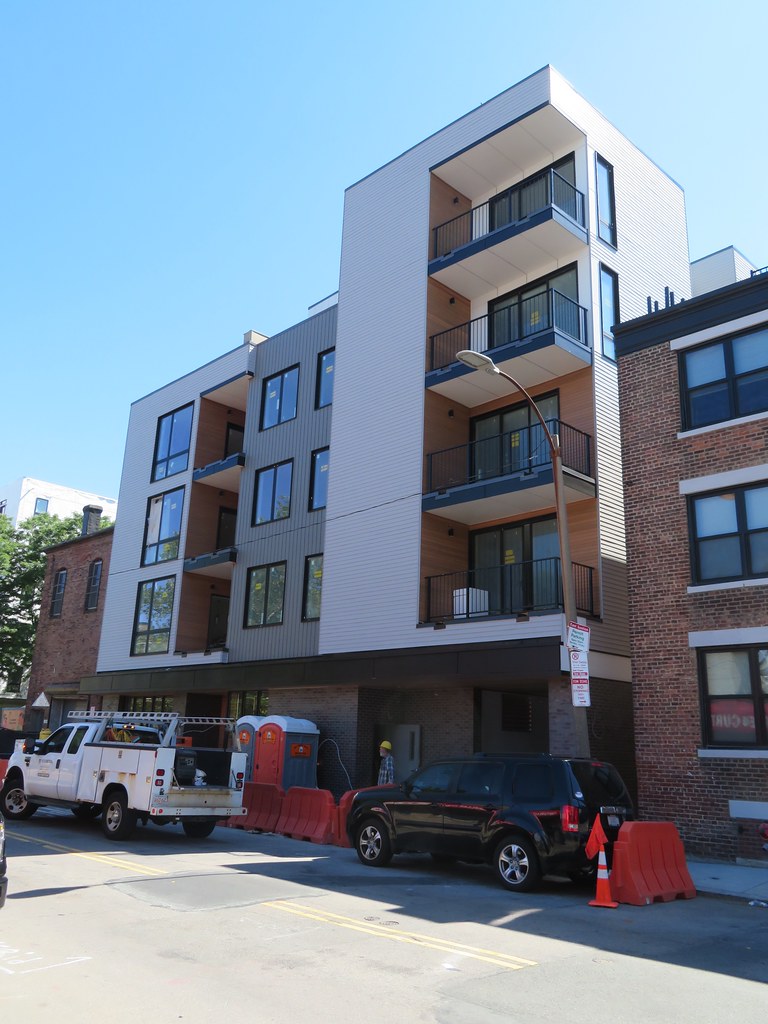 IMG_7593
 IMG_7596
 IMG_7595
 IMG_7598
 IMG_7599
 IMG_7601
 IMG_7602
 IMG_7606
 IMG_7611
 IMG_7603
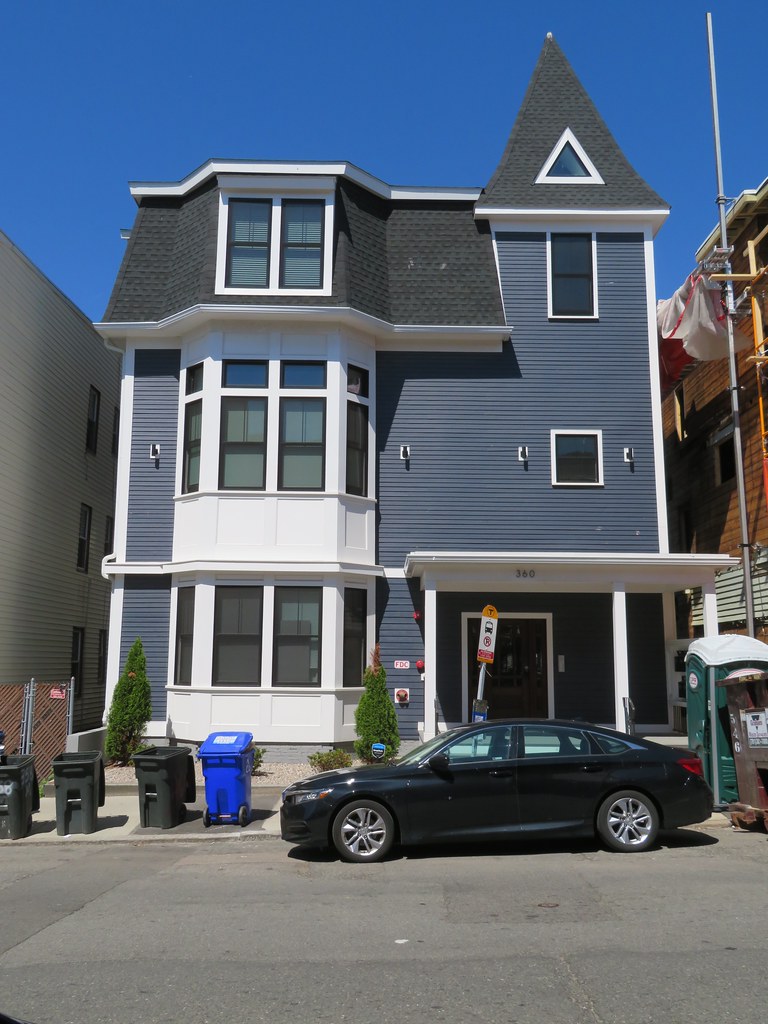 IMG_7610
 IMG_7605
 IMG_7614
 IMG_7616
 IMG_7617
 IMG_7620
 IMG_7623
 IMG_7625
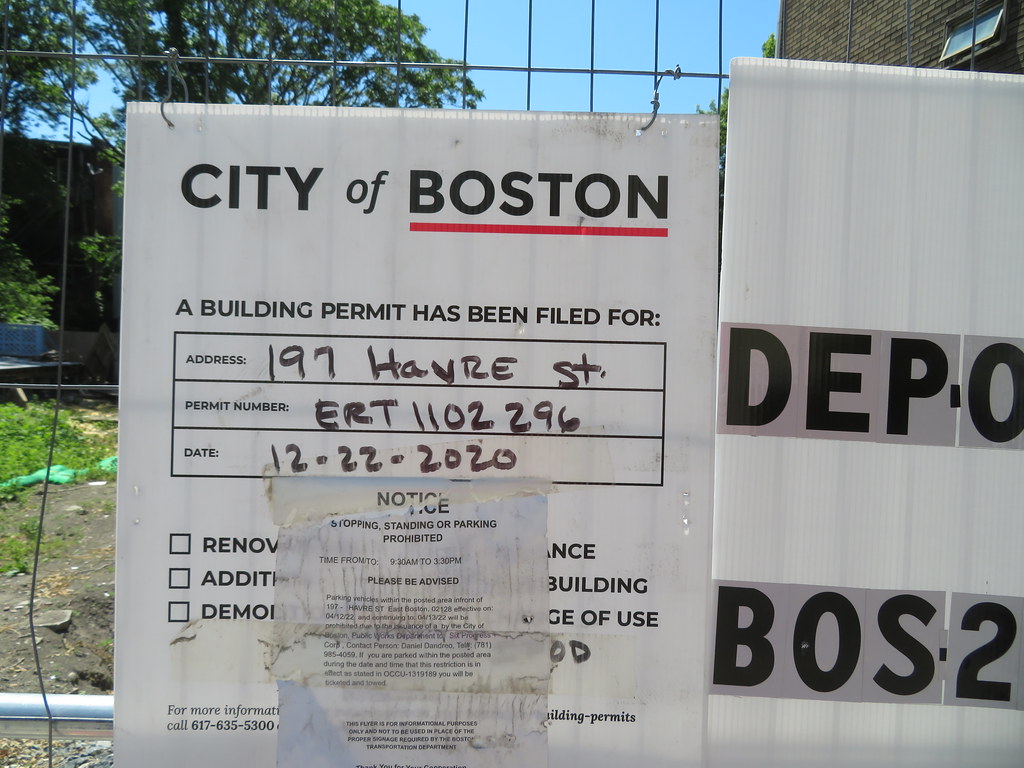 IMG_7629
 IMG_7628
 IMG_7648
 IMG_7650
 IMG_7651
 IMG_7652
 IMG_7656
 IMG_7657
 IMG_7659
 IMG_7660
 IMG_7661
 IMG_7669
 IMG_7667
 IMG_7668
 IMG_7671
 IMG_7673
 IMG_7674
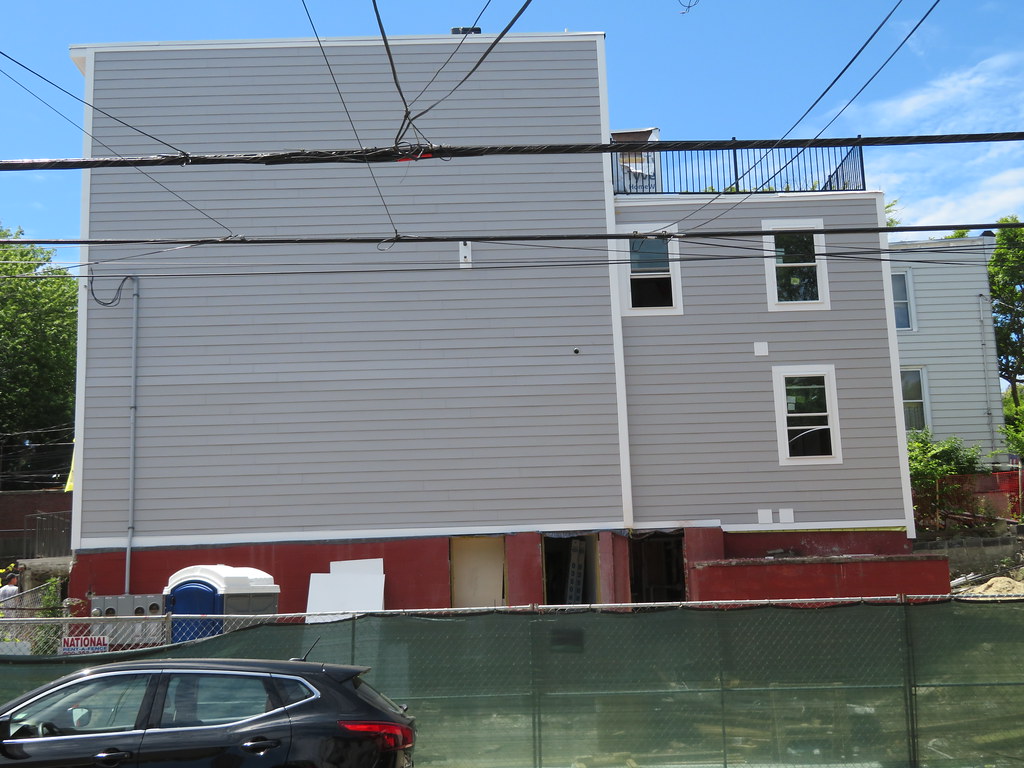 IMG_7684
 IMG_7685
 IMG_7683
 IMG_7687
 IMG_7690
 IMG_7692
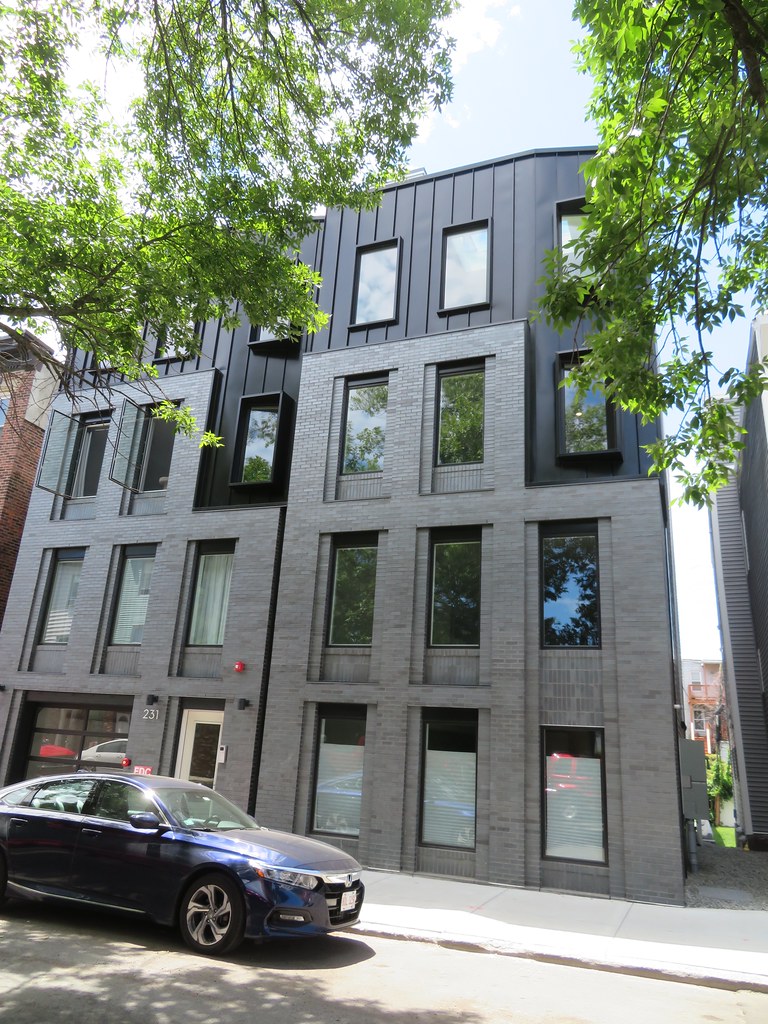 IMG_7694
 IMG_7697
 IMG_7700
 IMG_7704
 IMG_7701
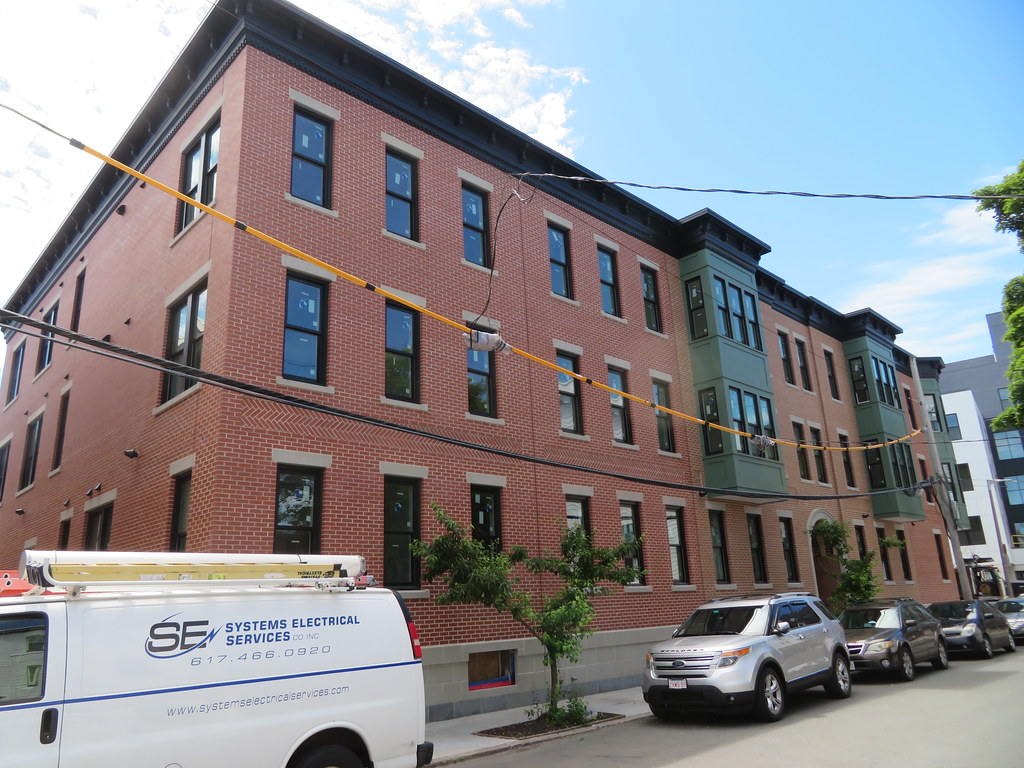 IMG_7702
 IMG_9825
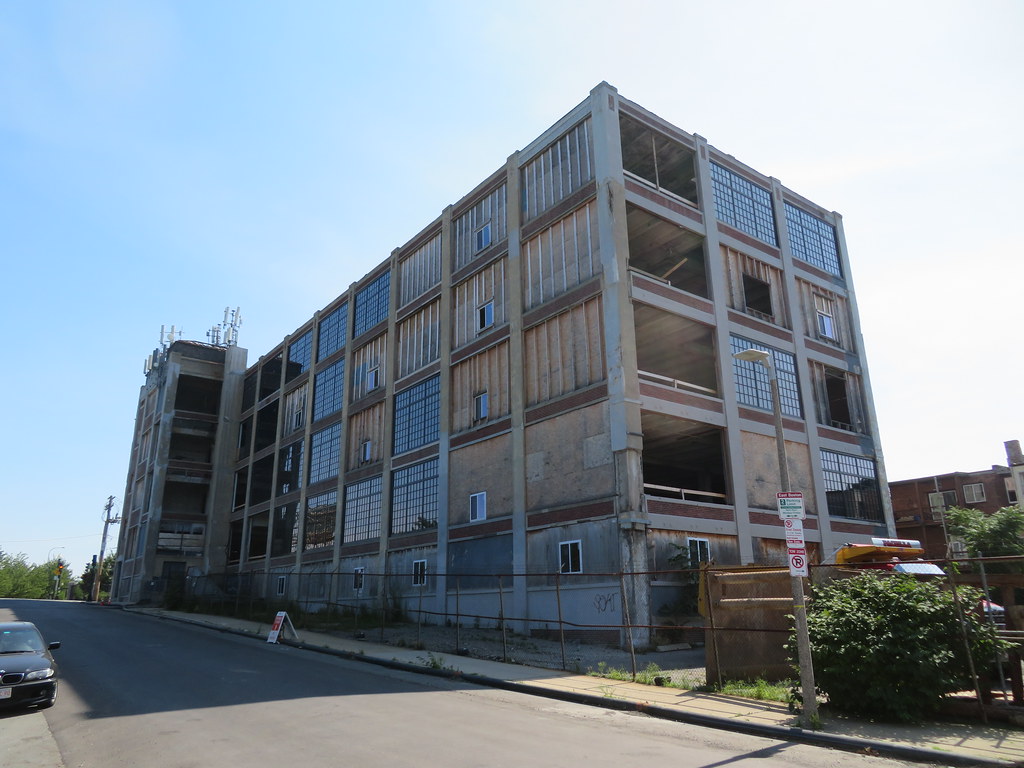 IMG_9826
 IMG_9835
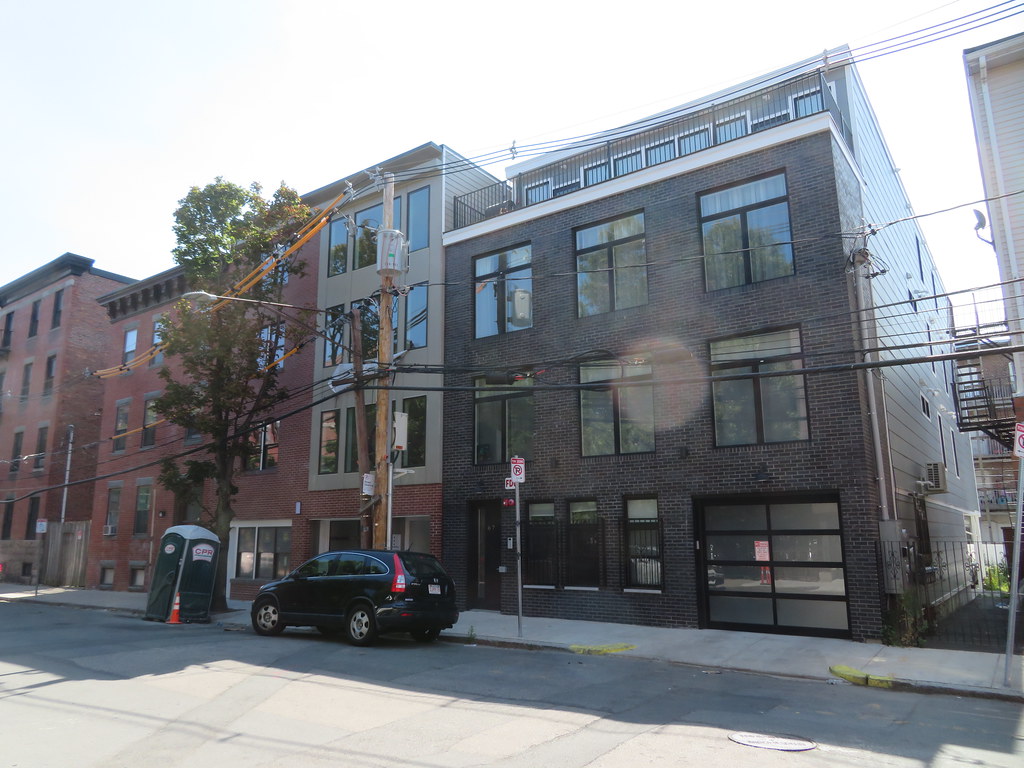 IMG_9837
 IMG_9840
 IMG_9844
 IMG_9846
 IMG_9849
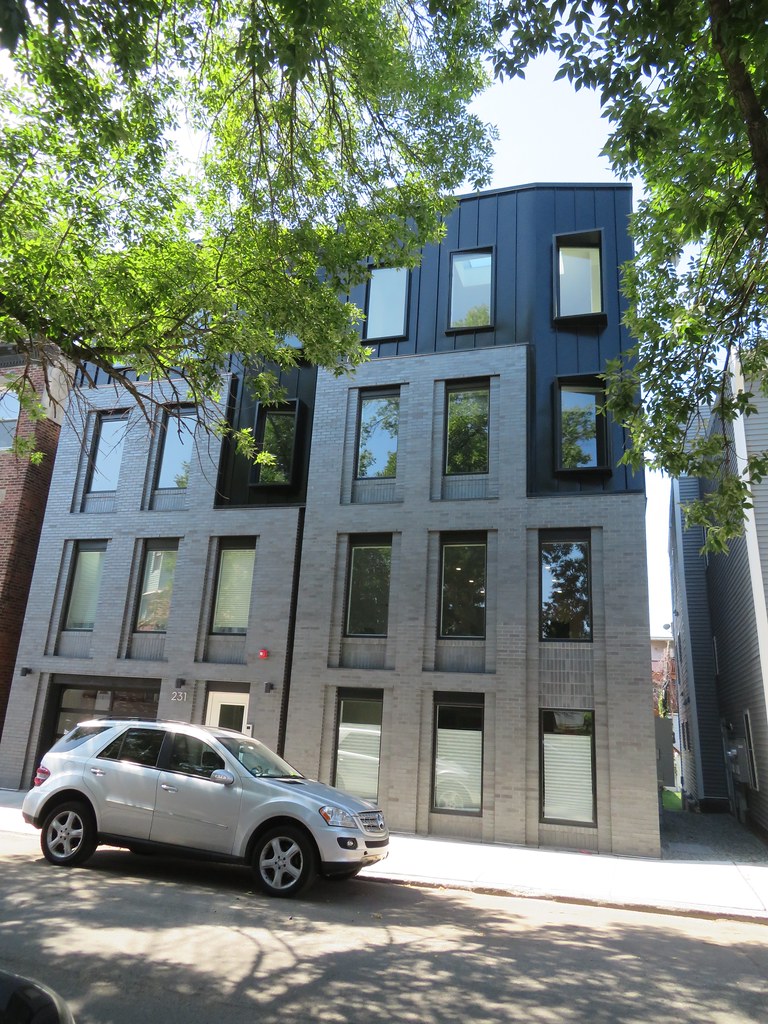 IMG_9851
 IMG_9848
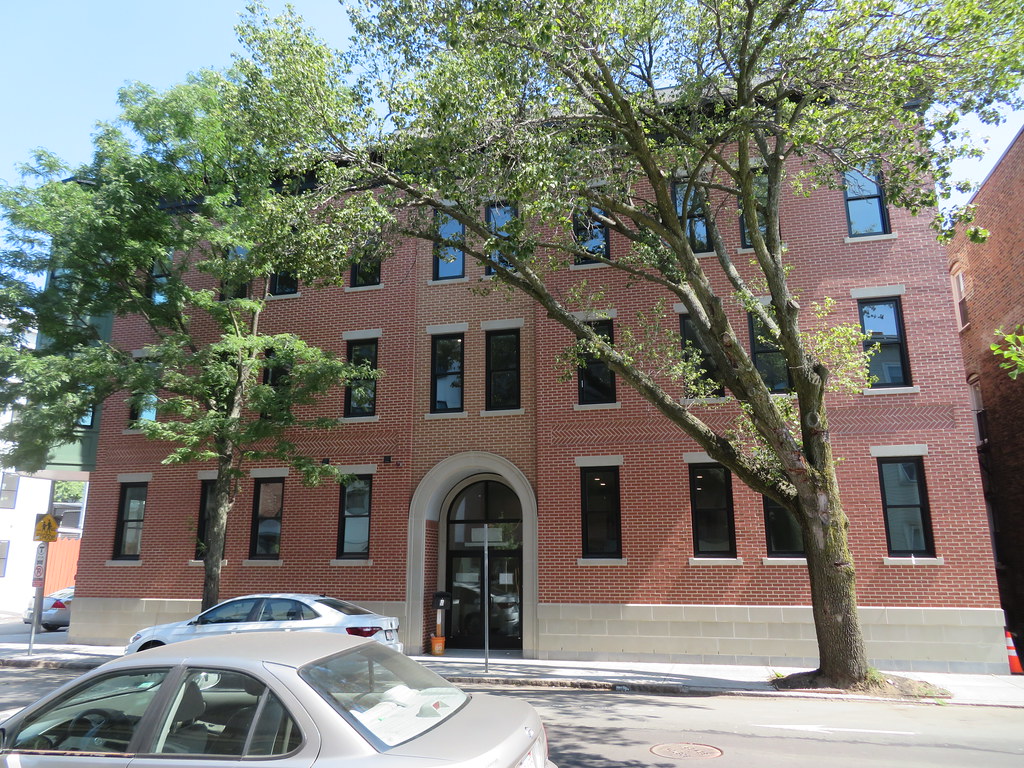 IMG_9857
 IMG_9860
 IMG_9861
 IMG_9853
 IMG_9863
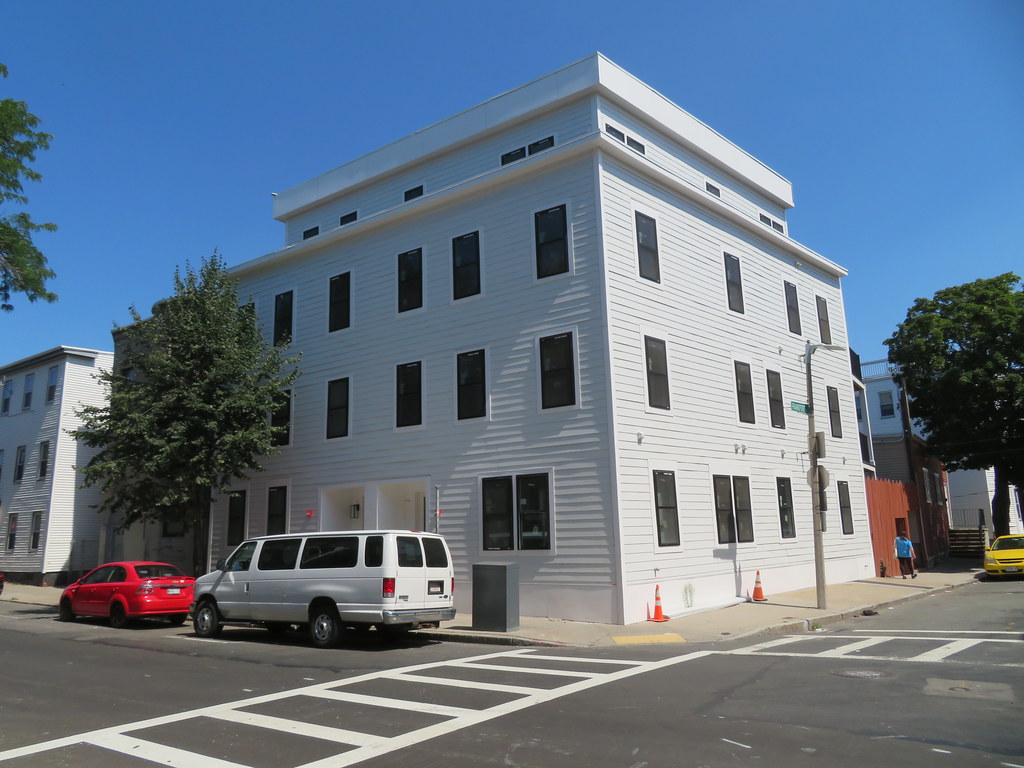 IMG_9859
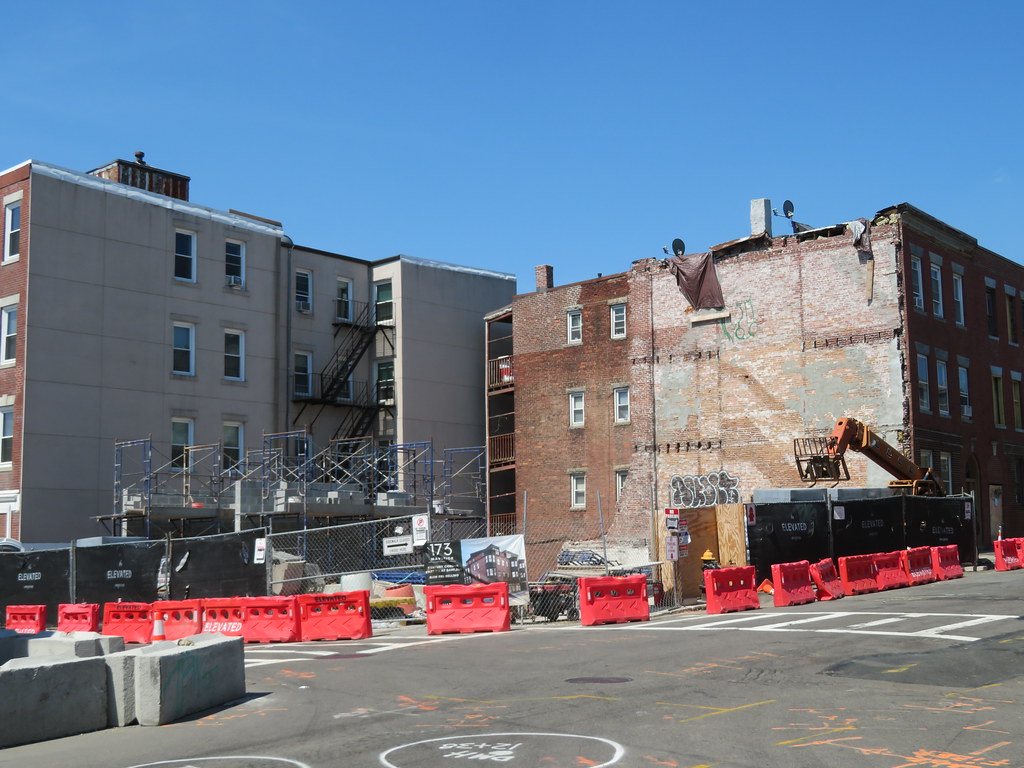 IMG_9870
 IMG_9873
 IMG_9876
 IMG_9879
 IMG_9882
 IMG_9884
 IMG_9892
 IMG_9890
 IMG_9911
 IMG_9914
 IMG_9920
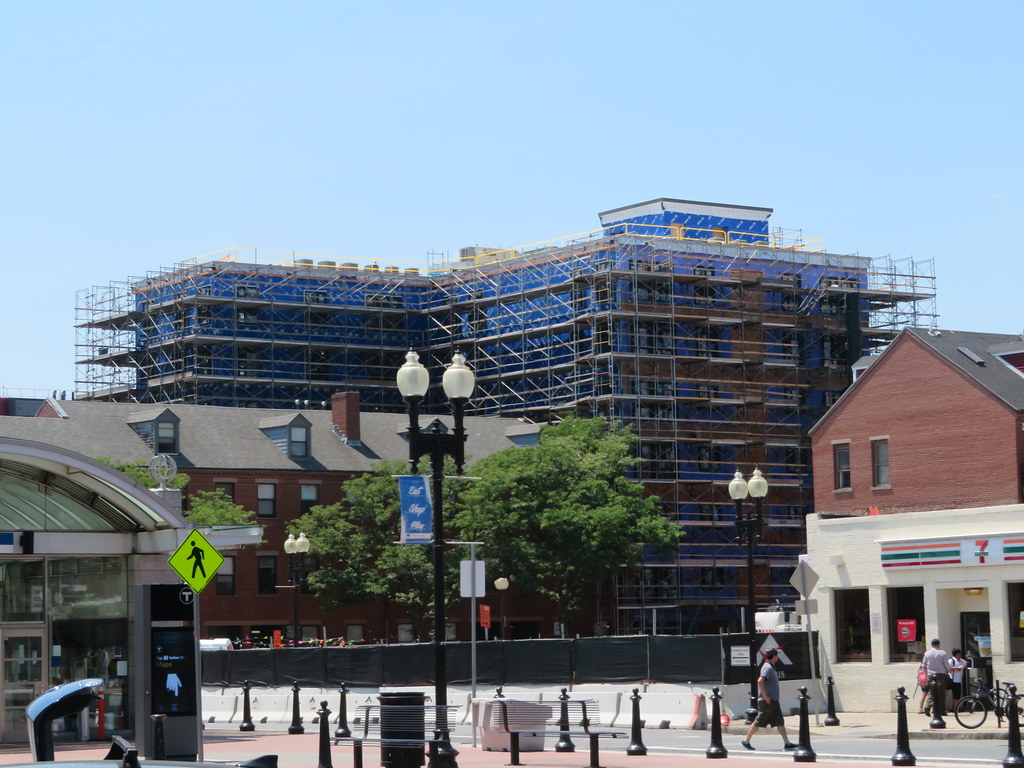 IMG_9959
 IMG_9912
 IMG_9922
 IMG_9939
 IMG_9940
 IMG_9942
 IMG_9943
 IMG_9944
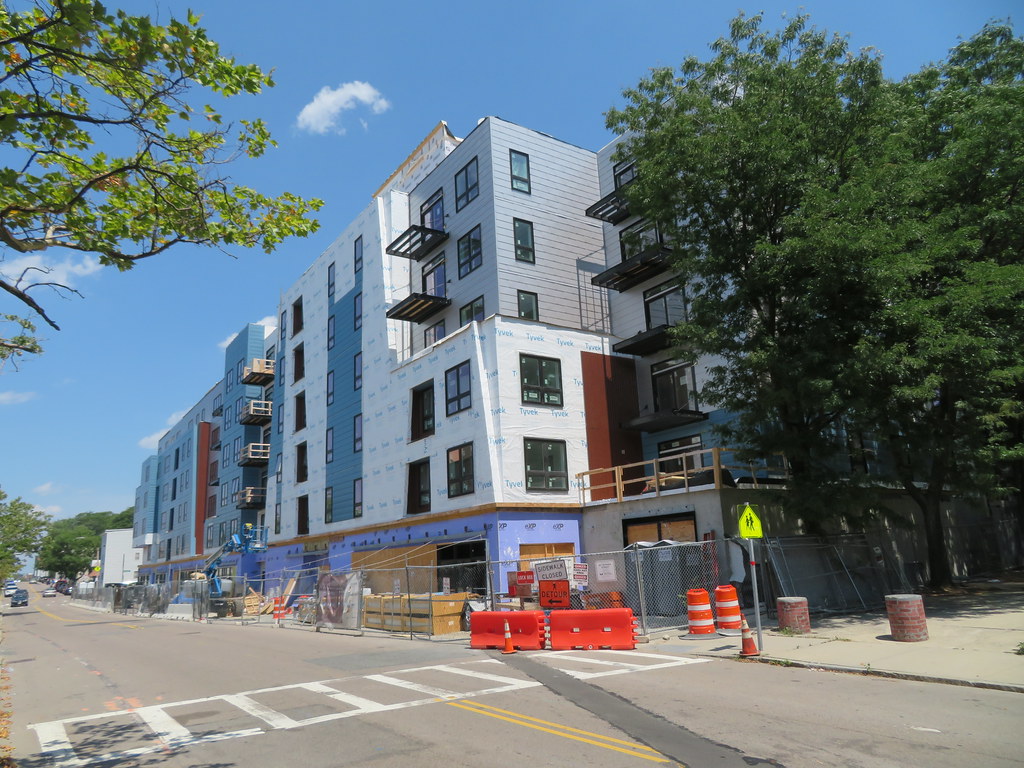 IMG_9945
 IMG_9950
 IMG_3715
 IMG_3722
 IMG_3742
 IMG_3755
 IMG_3761
 IMG_3762
 IMG_3765
 IMG_3773
 IMG_3819
 IMG_3825
 IMG_3826