General MBTA Topics (Multi Modal, Budget, MassDOT)

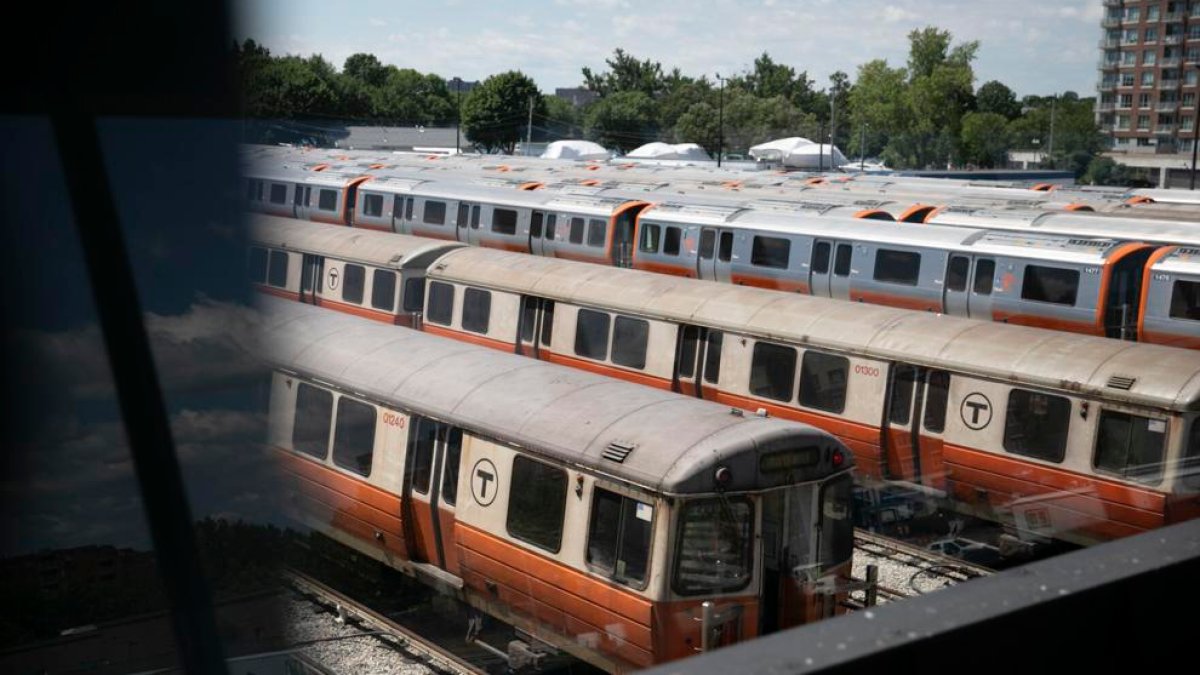
Interesting. The MBTA put out a video recently on social media explaining that the Type-10s would eliminate the screech due to some special lubricating system. That makes me think they don't have any plans for addressing it prior to Type-10 rollout. If they did something more recently that addressed the sound, I'm surprised they didn't crow about that, too.
The graphite lubricating "flange stick" they showed in that video isn't exactly new to the T. They introduced them as early as 2017 on all the type 8s.

 
What about the squeal at Government Center WB, it's probably worse than the Boylston one since it's the transfer from the Blue Line, and the only way to reach the Red Line, aside from the OL.
 
Green Line service changes effective December 17th. Early morning trip times shift to increase overnight maintainance windows, as well as frequency decreases in the early morning hours. Certain early morning trips from Union Square will be rerouted to Heath Street for early morning service there.


In addition, many bus routes are seeing schedule reductions, although they are listed in "departure time changes". Examples: Routes 90, 94, 96, and 501 are seeing schedule reductions, reduced frequencies, longer travel times, and service cuts. However they are incorrectly listed in "departure time changes", and not "decreased frequency".
 
Last edited:
A friend said they heard it yesterday, but I've also seen a handful of tweets saying it's gone. I'll pay more attention next time I'm heading Arlington -> Boylston.
I rode through a couple times this work week. While the squeal was still there, it was very much quieter as far as I could tell from inside the car. I don't know how it was on the platform where the cavernous tunnels seem to amplify and concentrate the sound toward the humans on the platforms, but, i suspect it was improved there even if still present.
 
Trips are often faster after the evening rush hour ends. It is best to analyze day to day data.

Below is November 16th, the same day 3 weeks before the shutdown and before the holiday weekend.

Trips took 16 - 20 minutes between 8PM and 10PM on 12/7. On 11/16 pre-shutdown, trips between 8PM and 10PM... seem to have took 16 - 20 minutes as well.

View attachment 45443
Took the Green line out to the ends of the GLX a couple times this week, as well, and I saw one indicator that speeds and travel times may be getting better: waiting several minutes for a platform to open up to allow an incoming outbound train to berth at Union and Medford- Tufts.

Perhaps they're waiting to also update travel times after these repairs before updating schedules?
 
GTFS for Winter 2024 has been released:

This winter, there will be no changes to the MBTA frequency map. (No changes were made to Sunday service that crossed thresholds).

Detailed service changes:
Frequency decreases:
Weekdays: Rt 7 (-5), Rt 11 (-5), Rt 19 (-3), Rt 34 (-1), Rt 37 (-1), Rt 51 (-1), Rt 65 (-3), Rt 116 (-1), Rt 137 (-5), Rt 220 (-4), Rt 222 (-1), Rt 225 (-6), Rt 226 (-1), Rt 230 (-2), Rt 442 (-1), Rt 501 (-4), Rt 505 (-1), SLW (-1), SL3 (-3), GL B (-2), GL C (-8), GL D (-6), GL E (-1), Red Line (-4, -4, total -8)
Saturdays: Rt 90 (-1), Rt 116 (-1), SLW (-1), GL D (-2), Red Line (-2, -2, total -4)
Sundays: Rt 94 (-1), Rt 96 (-1), Rt 116 (-1), Red Line (-2, -2, total -4)

Frequency increases:
Weekdays: Rt 21 (+2), Rt 31 (+2), Rt 32 (+2), Rt 42 (+2), Rt 104 (+2), Rt 109 (+2), Rt 117 (+1), Rt 210 (+3), Rt 211 (+3), Rt 215 (+2), Orange Line (+7)
Saturdays: Rt 117 (+1)
Sundays: Rt 137 (+1), Rt 712 (+1)

6 Subway lines will see reduced service this winter. 1 subway line will see increased service this winter.

22 bus routes will see reduced service this winter. 11 bus routes will see increased service this winter.

Old maps: Fall 2023 (2023 Q4) Summer 2023 (2023 Q3), Spring 2023 (2023 Q2v2), Pre-slow zone map (2023 Q2), Original map (2023 Q1) (Oldest map available)
1702234399851.png
 
MBTA reports another near miss safety incident at Riverside station.

 
MBTA reports another near miss safety incident at Riverside station.

That thing is gonna collapse. Hence why I don’t go there anymore
 
New YouTube video about the MBTA's woes just dropped. Interestingly, despite the title, the thesis doesn't focus on the actual nitty gritty of why the system isn't working but uses the issues as a vehicle for talking about network design, and a odd tangent about the makeup of the T's board.

 
New YouTube video about the MBTA's woes just dropped. Interestingly, despite the title, the thesis doesn't focus on the actual nitty gritty of why the system isn't working but uses the issues as a vehicle for talking about network design, and a odd tangent about the makeup of the T's board.

Yeah, found the idea that Quincy is beholden to commuter rail amusing. Also, neglecting to even mention NSRL is egregious.
 
The Commonwealth certified zoning laws in Lexington and Salem to be in compliance with the new statewide MBTA communities zoning law.

But so far it's not making much of a difference in either of those places:

 
Yeah, found the idea that Quincy is beholden to commuter rail amusing. Also, neglecting to even mention NSRL is egregious.
He also completely dismisses the idea that Boston should have any interest in regional rail. There are 21 commuter rail stops within the city of Boston. These could potentially serve a very large number of people as we move to a full regional rail model. I would hope the Boston representative on the Board is thinking about these issues.
 
He also completely dismisses the idea that Boston should have any interest in regional rail. There are 21 commuter rail stops within the city of Boston. These could potentially serve a very large number of people as we move to a full regional rail model. I would hope the Boston representative on the Board is thinking about these issues.
Anyone know what the profitability of the commuter rail looks like, compared to the subway? If the complaint is that it services wealthier communities, then it might follow that there’s more economic benefit to the T itself to improve CR.
 
Looking at the 2019 NTD profile from here: https://www.transit.dot.gov/ntd/transit-agency-profiles/massachusetts-bay-transportation-authority

Commuter rail accounted for 26% of operating expenses, 36% of revenue, and 32.3% of capital expenses (which tends to skew toward major projects). Farebox recovery was 62% - lower than ferry and heavy rail, and about the same as heavy + light rail combined.

1702676435751.png


The spreadsheet with a few other columns is attached (zipped, because the forum software doesn't accept .xls)
 

Attachments

  • 2019 MBTA NTD data.zip
    11.7 KB · Views: 40
Looking at the 2019 NTD profile from here: https://www.transit.dot.gov/ntd/transit-agency-profiles/massachusetts-bay-transportation-authority

Commuter rail accounted for 26% of operating expenses, 36% of revenue, and 32.3% of capital expenses (which tends to skew toward major projects). Farebox recovery was 62% - lower than ferry and heavy rail, and about the same as heavy + light rail combined.

View attachment 45664

The spreadsheet with a few other columns is attached (zipped, because the forum software doesn't accept .xls)
The trolleybus expenses are total bs. The T was trying to get rid of the catenary and cooked the numbers to justify it
 
Here's a comparison of gated subway station entries (proxy for ridership at gated stations) between Jan-Oct 2019 and Jan-Oct 2023:
1702711321992.png


The numbers are pulled from this dataset, summed over all dates and all times until October 31.

(Wollaston being #1 is a result of its closure in 2019 for renovations.)

My thoughts:
  • Overall, recovery ratios seem to be most influenced by the reliability of the subway line, which is itself influenced by slow zones and reduced headways. Blue line stations rank very high, and the line is also the most reliable. The Red Line branches are well below average, likely because their service standards are laughable in 2023.
  • P&R stations on the Red and Orange lines are generally at the bottom of the list (Wellington, Alewife, Quincy Adams, Braintree). This is likely a combination of both the lines being unreliable prompting people to drive into downtown instead, and lower demand from peak-oriented commuters due to WFH.
    • Two notable exceptions are Wonderland (very well) and Riverside (near average). Wonderland could be due to how Blue Line itself fares much better, while Riverside may also benefit from being used for events. For this reason, I think the Red and Orange P&Rs may have more to do with the lines than WFH.
  • Many downtown stations on the Red and Orange lines don't do well (DTX, South Station, Haymarket, Back Bay). WFH may again be the reason, but they can also be a result of bad service on the Red and Orange lines, as I'll discuss below.
  • However, some other downtown stations on the Blue and Green lines do surprisingly well: Boylston, Hynes, Government Center, Aquarium, Prudential, Copley, State. Possible reasons are:
    • Spillover effects from the Blue Line doing so well, thus benefitting its downtown stations
      • This would mean that commuter ridership is certainly not hopeless even in a WFH world
    • Demand from shoppers (Copley, Hynes, Prudential), tourists (GC, State, Aquarium) and diners (Boylston??), which are more resistant to WFH
    • So, again, the Red and Orange downtown stations probably have more to do with Red and Orange themselves.
  • I was very surprised World Trade Center ranks so high (I expected it to be worse than Courthouse). Maybe, just maybe, people that live in luxury apartments in Seaport actually take public transit!
  • Davis likely suffered from GLX.
  • Lechmere likely suffered from fare evasion, despite increased service from two branches instead of one. However, I'm not sure about their methodology for GLX stations.
    • Science Park being so high is probably due to increased service, which gives heavy credence to the idea that these numbers do not account for fare evasion, and really highlights how bad Lechmere is.
    • Likewise, the numbers alone for GLX stations may also be deflated.
 
Last edited:
  • I was very surprised World Trade Center ranks so high (I expected it to be worse than Courthouse). Maybe, just maybe, people that live in luxury apartments in Seaport actually take public transit!
I think this is as much a function of the other development that has happened in the area as well not just the housing. Also, the SL3 opened in 2018 and the housing and transportation shifts take some time to result in changes to ridership. From what I hear the SL3 to Seaport ridership is pretty good.
  • Davis likely suffered from GLX.
  • Lechmere likely suffered from fare evasion, despite increased service from two branches instead of one. However, I'm not sure about their methodology for GLX stations.
    • Science Park being so high is probably due to increased service, which gives heavy credence to the idea that these numbers do not account for fare evasion, and really highlights how bad Lechmere is.
    • Likewise, the numbers alone for GLX stations may also be deflated.
Lechmere 2019 data should be comparable to the entirety of the GLX 2022 since most riders would likely have been a Lechmere bus transfer rider in 2019. Some people's new routines could've pulled trips from either Davis or Sullivan with bus transfer riders now using the GLX.

However, summing up the glx stations the to date total is about 1.7mn riders in comparison to 1.42mn in 2019 to date. Seems like Lechmere before GLX isn't as far off as Lechmere after GLX as the raw data would seem.
 
Here's a comparison of gated subway station entries (proxy for ridership at gated stations) between Jan-Oct 2019 and Jan-Oct 2023:
View attachment 45679

The numbers are pulled from this dataset, summed over all dates and all times until October 31.

(Wollaston being #1 is a result of its closure in 2019 for renovations.)

My thoughts:
  • Overall, recovery ratios seem to be most influenced by the reliability of the subway line, which is itself influenced by slow zones and reduced headways. Blue line stations rank very high, and the line is also the most reliable. The Red Line branches are well below average, likely because their service standards are laughable in 2023.
  • P&R stations on the Red and Orange lines are generally at the bottom of the list (Wellington, Alewife, Quincy Adams, Braintree). This is likely a combination of both the lines being unreliable prompting people to drive into downtown instead, and lower demand from peak-oriented commuters due to WFH.
    • Two notable exceptions are Wonderland (very well) and Riverside (near average). Wonderland could be due to how Blue Line itself fares much better, while Riverside may also benefit from being used for events. For this reason, I think the Red and Orange P&Rs may have more to do with the lines than WFH.
  • Many downtown stations on the Red and Orange lines don't do well (DTX, South Station, Haymarket, Back Bay). WFH may again be the reason, but they can also be a result of bad service on the Red and Orange lines, as I'll discuss below.
  • However, some other downtown stations on the Blue and Green lines do surprisingly well: Boylston, Hynes, Government Center, Aquarium, Prudential, Copley, State. Possible reasons are:
    • Spillover effects from the Blue Line doing so well, thus benefitting its downtown stations
      • This would mean that commuter ridership is certainly not hopeless even in a WFH world
    • Demand from shoppers (Copley, Hynes, Prudential), tourists (GC, State, Aquarium) and diners (Boylston??), which are more resistant to WFH
    • So, again, the Red and Orange downtown stations probably have more to do with Red and Orange themselves.
  • I was very surprised World Trade Center ranks so high (I expected it to be worse than Courthouse). Maybe, just maybe, people that live in luxury apartments in Seaport actually take public transit!
  • Davis likely suffered from GLX.
  • Lechmere likely suffered from fare evasion, despite increased service from two branches instead of one. However, I'm not sure about their methodology for GLX stations.
    • Science Park being so high is probably due to increased service, which gives heavy credence to the idea that these numbers do not account for fare evasion, and really highlights how bad Lechmere is.
    • Likewise, the numbers alone for GLX stations may also be deflated.

Great post! Are we sure the methodology doesn't use something other than fare gate/validation interaction for GLX, because I'd expect the numbers to be much lower. If those numbers are just the people who validate their fares at GLX stations, then the true ridership on the GLX is off the charts amazing, based on my observations of how low fare compliance is at those stations.

I'll echo @as02143 that Lechmere's drop is due in large part to GLX. In 2019, it's likely that a huge percentage of Lechmere riders were transfering to/from the 80, 87, or 88. Now, many of those riders are staying on the Green Line past Lechmere.

Much of North Quincy's drop is likely due to the re-opening of Wollaston. In 2019, many riders who would normally use Wollaston used North Quincy instead, whether utilizing the shuttle or otherwise. This is obviously in addition to the fact that service on the Braintree Branch has been abysmal for much of 2023.

Much of Quincy Adams' drop is likely due to the parking contraints while the South Shore Garages project continues. This is obviously in addition to the fact that service on the Braintree Branch has been abysmal for much of 2023.

Alewife is probably the true largest proportion drop without exceptional circumstances. That makes sense as the Red Line has seen the largest degradation in service and Alewife was the Red Line stop that served the largest proportion of its riders as white-collar workers that likely went WFH (or switched to the Commuter Rail).
 
Update: I found that there's an issue with the 2019 data that cuts off ridership from Jan 1 to Jan 4, as the file exceeds 1048576 rows when opened in Excel. The effect should be minor, however. I'll come back in a few days with fixed data for all years (2014-2023).

I think this is as much a function of the other development that has happened in the area as well not just the housing. Also, the SL3 opened in 2018 and the housing and transportation shifts take some time to result in changes to ridership. From what I hear the SL3 to Seaport ridership is pretty good.
While I certainly think WTC draws ridership from non-residents (e.g., people commuting or shopping there), I'd expect such effects to be much bigger at Courthouse. As I analyzed here, Courthouse's PM peak inbound ridership (commuters) in Fall 2022 is 5x that of its AM peak inbound ridership (residents), whereas WTC is about 2.5x and SLW is 2x. Also, Courthouse's PM peak inbound ridership is 54% more than WTC and 87% more than SLW. So while I was wrong in my initial comment for implying that WTC's ridership is primarily from residents, I think the overall point still stands that if WTC's ridership boost comes from non-residents, the same should apply to Courthouse.

Lechmere 2019 data should be comparable to the entirety of the GLX 2022 since most riders would likely have been a Lechmere bus transfer rider in 2019. Some people's new routines could've pulled trips from either Davis or Sullivan with bus transfer riders now using the GLX.

However, summing up the glx stations the to date total is about 1.7mn riders in comparison to 1.42mn in 2019 to date. Seems like Lechmere before GLX isn't as far off as Lechmere after GLX as the raw data would seem.
Great post! Are we sure the methodology doesn't use something other than fare gate/validation interaction for GLX, because I'd expect the numbers to be much lower. If those numbers are just the people who validate their fares at GLX stations, then the true ridership on the GLX is off the charts amazing, based on my observations of how low fare compliance is at those stations.

I'll echo @as02143 that Lechmere's drop is due in large part to GLX. In 2019, it's likely that a huge percentage of Lechmere riders were transfering to/from the 80, 87, or 88. Now, many of those riders are staying on the Green Line past Lechmere.
These are good points. On a second thought, I do agree that using only validation data would likely make the numbers way too low. However, my initial comment comes from the opinion that if these are actual station entries (with and without payment), the 2023 ridership numbers for individual GLX stations seem too low when compared to other stations.
  • East Somerville would have the lowest ridership among all gated stations except Mattapan Line. (Not too surprising, but still...)
  • Magoun Square would be the 3rd lowest, only behind East Somerville and Suffolk Downs (where 3/4 of its walkshed is wasteland).
  • Gilman Square, Ball Square and Medford/Tufts would each have ridership comparable to Savin Hill, a textbook example of a low-ridership station on the Red Line. They're also slightly lower than Science Park, Shawmut and Riverside - the first two are clearly low-ridership stations, and Riverside is basically P&R only.
  • Union Square, which has the highest ridership among brand-new GLX stations, has ridership similar to or lower than Wollaston, Quincy Adams, Braintree, Wood Island and Green Street. With the possible exception of Green Street, it appears that all the other four stations lack the high density and/or high downtown-oriented demand that Union Square has.
    • This could have been impacted by the closures on the Union Square branch in 2023.
If these are full ridership numbers, I have to say that I expected better from GLX given the density of Somerville surrounding each of these stations (not to mention much better service standards than the Red Line branches).

Also, while bus transfer may account for some of Lechmere's reductions, I don't think most or all GLX riders today transferred at Lechmere in 2019. Residents near Medford/Tufts would have probably taken the 94/96 to Davis (as seen from the huge ridership drop at Davis), and residents near Ball Square may be just as likely to take 89/101 (both of which have better frequency than 80) to Davis and Sullivan compared to 80 to Lechmere. Even Union Square has 85, 86, 91 and CT2 to Red and Orange lines in addition to 87.

So while 1.7 million GLX riders in 2023 (including Lechmere) may seem comparable to 1.5 million Lechmere riders in 2019 (which would have been <1 million given the Covid discount) on the surface, I still expected better from GLX, considering the relief to Red and Orange lines that it was expected to produce (which has materialized at Davis). Not to mention it doesn't sound great for mode shift, as GLX has much better service standards than the 80, 87 and 88 buses. We shouldn't even be comparing Magoun Square to Suffolk Downs in the first place, and it doesn't seem to align with my experiences of actually riding GLX - which led me to question the data.
 
Last edited:

Back
Top