The "15" symbol means every 15 or less, not exactly 15 minute headways. I believe the "T" routes (now without the T designation) are largely planned to be 8-11 minute headways depending on time of day.
So yeah, that MBTA map had been on my radar for a few weeks (I think it was you who brought it up, so kudos), and I do plan to try recreating that at some point. Of course, working on that also means a dedicated job density map as a byproduct - I hear the calls from all other comments above you.
Has the MBTA mentioned the exact formula, or weighting between residents and jobs, that they used to create their "composite transit demand" metric? I see your second screenshot about some general ranges of residential and employment density they used to categorize service levels, so I can try reverse-engineering the weights, but a more explicit measure would obviously be better.
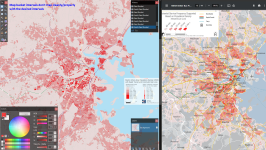
I do see how that can be a concern. The color scales were generated automatically using the Jenks natural breaks optimization, which I picked because it shows the nuances of urban areas pretty well - and urban areas were my initial focus. I'll see if there's a systematic way to finetune low-density areas further (perhaps adding one more color class?).
I got around to tinkering with the new 2020 population map and trying to reverse decode the conversion factors from population density to frequency, and same for employment (for employment I simply tinkered with this tool to compare with the T's map)
A factor of 7.5 residents/people per acre, or 4800 residents/people per square mile, is roughly equivalent to hourly transit service. (Use the population weighted adjustment factors in the MBTA's PDF to get the "adjusted population density" map.)
A similar factor of 7.5 employees/jobs per acre, or 4800 employees/people per square mile, is also roughly equivalent to hourly transit service.
For the attached screenshots of Teban54's population map, I can't get the exact buckets since the 2020 map buckets do not map cleanly to the proper intervals for testing.
Anyhow, here's the conversion tables as needed to recreate the MBTA's market analysis frequencies map:
Important definition: Density can refer to:
1. Population density
2. Employment density
3. Combined total population + employment density.
They all use the same conversion table/factor. So a parcel with 30 residents and 30 jobs per acre (4 vph - 15 min headways individually), gives a combined density of 60 per acre = 8 vph = 8 min supported frequency.
This conversion factor is likely probably the factor used by the MBTA to create their maps. Whether the conversion factor likely used by the T to convert from densities to supported frequencies, should be higher or lower, is another matter, but the conversion factor below is the one that would best recreate the MBTA's map.
The underlined values are the bucket values needed for a 8-color-scale, and the italicized one for if a 9th color scale is available. (Parcels as 0 should be marked "0" using a "null" color)
Supported transit service frequency
Density per acre
Density per square mile
Density per square kilometer
N/A
0
0
0
Every 2 hours or less frequent (< 0.5 vph) - SATS
0.01 - 3.75
1 - 2400
1 - 926
Every 80 - 120 minutes (0.5 - 0.75 vph) - SATS
3.75 - 5.625
2400 - 3600
926 - 1389
Every 60 - 80 minutes (0.75 - 1 vph) - SATS
5.625 - 7.5
3600 - 4800
1389 - 1852
Every 40 - 60 minutes (1 - 1.5 vph) - SATS
7.5 - 11.25
4800 - 7200
1852 - 2778
Every 30 - 40 minutes (1.5 - 2 vph) - SATS
11.25 - 15
7200 - 9600
2778 - 3704
Every 24 - 30 minutes (2 - 2.5 vph) - SATS
15 - 18.75
9600 - 12000
3704 - 4630
Every 20 - 24 minutes (2.5 - 3 vph) - SATS
18.75 - 22.5
12000 - 14400
4630 - 5556
Every 15 - 20 minutes (3 - 4 vph) - PWTL
22.5 - 30
14400 - 19200
5556 - 7408
Every 12 - 15 minutes (4 - 5 vph) - PDJW
30 - 37.5
19200 - 24000
7408 - 9260
Every 10 - 12 minutes (5 - 6 vph) - PDJW
37.5 - 45
24000 - 28800
9260 - 11112
Every 8 - 10 minutes (6 - 8 vph) - SUAW
45 - 60
28800 - 38400
11112 - 14816
Every 6 - 8 minutes (8 - 10 vph) - SUAW
60 - 75
38400 - 48000
14816 - 18520
Every 5 - 6 minutes (10 - 12 vph) - SUAW
75 - 90
48000 - 57600
18520 - 22224
Every 3 - 5 minutes (12 - 20 vph) - SUAG
90 - 150
57600 - 96000
22224 - 37040
Every 2 - 3 minutes (20 - 30 vph) - SUAG
150 - 225
96000 - 144000
37040 - 55560
Every 1.5 - 2 minutes (30 - 40 vph) - SUAG
225 - 300
144000 - 192000
55560 - 74080
SUAG - "show up and go"
SUAW - "show up and wait"
PLJW - "plan departure, journey whenever"
PWTL - "plan when to leave"
SATS - "schedule around the schedule"
I essentially just marked these for each multiple of 5, so 5 - 10 - 15 - 20 until I ran out.
To get an ideal walkshed for a subway station, a gridded street layout would give = (.5 mile walkshed + gridded street grid = a diagonal square with diagonal sides of 0.7 mi (1 mile total - .5 mi walk on a N-S/E-W street on either side of a station) = 0.5 square mile walkshed.
So for a subway station to have at least a density to support at least 10 minute service (highlighted in red in the table), you want a minimum of 14,400 residents and jobs combined within the diagonal square (since a 10 minute walkshed can only cover 0.5 sq miles on a perfect street grid - 28,800 per sq mile for 10 minute service - 0.5 sq miles = 14,400).
If using perfect circles for these measurements, the 10 minute walkshed in a perfect circle is 0.785 sq miles, or 22,608 jobs and residents combined in a given circle for a 10 minute subway service (out of 28,800 sq mi density).
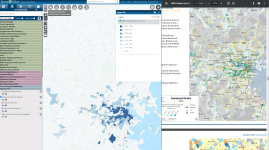
Of the ~1.27 million population within the BERy service area, ~762.7k live within a 10 minute walk of a current or historical railroad ROW; or subway station (60%) (includes all mainline RR ROWs, the Cambridge subway, East Boston subway, Seaport transitway, and the Green Line tunnel).
Including Lynn, Quincy, Waltham, and Melrose, ~822.9k out of a total of ~1.58 million live within a 10 minute walk of the aformentioned RR ROWs (52.1%).
868.7k can be covered with extensions from Lynn/Waltham/Quincy terminals (& Wyoming Hill), to Swampscott/Roberts/Braintree/Melrose Highlands (55.0%).
14,200 out of 49,000 Everett residents live within a 10 minute walk of the Saugus Branch Railroad or the Eastern Railroad (the aformentioned map tool I used gave me 41.5k (34.2%) for Everett total).
33,000 out of 76,000 Allston Brighton residents live within a 10 minute walk of the Boston & Worcester (B & A) Railroad (~27,500 - 39.3%) or the Highland Branch Railroad (~5,510 - 7.9%). (The same map tool gave me 69.8k for the neighborhood population - 47.2%)
- Conversion of the 64, 65, 86, and 70 to frequent bus routes (alongside the 66 and B branch - the 64 truncated to Faneuil), and a B & A subway replacing the 57 as the high frequency east-west route, would provide high frequency service to 92.4% of Allston-Brighton within a 10 minute walk, covering all of the densest parts of the neighborhood. Only ~5,300 Brighton residents bordering Newton Corner would be without high frequency service under such a scenario. Almost the entirety are west of the Washington St & Breck Ave. 57 bus stop, in low density auto-centric parcels marked as supporting 30 minute or hourly service by the MBTA.
The "15" symbol means every 15 or less, not exactly 15 minute headways. I believe the "T" routes (now without the T designation) are largely planned to be 8-11 minute headways depending on time of day.
I think seasoned riders (and a skeptical public) know that "15 or less" with the T is going to be sometimes 7 then 1, 0.2, and then randomly 30 and rarely "15 or less". Even headways on a bus route of 8 to 11 still sounds like austerity planning from the T. There's no reason to accept the T's tap dance around it.
This was mentioned at the bottom of the post I had made. The post mentions raising the off peak headway to the weekday headway. The 7 - 8 minute headway is only during rush hour when the Orange Line uses all trainsets that can be utilized. Middays, evenings, and weekends the T does not use all trainsets that can be used. While rush hour is important, running "meh" to "bad" headways outside of rush hour is, well, not great.
This also inclues raising the Orange Line and the Green Line D and E branches from an atrocious off peak every 10 - 16 minute headways to at least an 8 minute headway.
MBTA Receives $67.6M from the FTA's All Stations Accessibility Program to upgrade 14 Green Line stops on the B and C branches to provide accessibility upgrades and compliance with the Americans with Disabilities Act. The MBTA won almost 20% of the available funds from the program.
The full list is as follows:
B-branch:
Chestnut Hill, Chiswick Road, Packard's Corner, South Street, and Sutherland Road
C-Branch:
Brandon Hall, Dean Road, Englewood Avenue, Fairbanks Street, Hawes Street, Kent Street, Saint Paul Street, Summit Avenue, and Tappan Street
Per the FTA, "Improvements will focus on improving safety, including installing accessible platforms for level boarding." I know that the stakes here are relatively low at ~5m per station, but I'm not convinced that light upgrades is the right move for some of these.
For example, All 9 of the C branch stations getting touched are, in my view, some the best candidates on the system for consolidation, but once they've been made accessible, especially on someone else's tab, I doubt we'd see any further action on them. That is doubly important since many of them are on the T's list of non compliant stations for the Type 10 platform requirements.
The B-Branch consolidations cost just ~29m in 2020 for 2 stations, replacing 4. Assuming that cost holds, escalating to 2024 dollars doing the same on the C for 3/9 would cost 55m. That's just about 1 million more than the feds are providing, (on a per station basis) but in T construction terms that's a pitance and would do quite a bit more for the system than just concrete platforms and some benches.
Why should CR riders be more deserving of accessible transit than GL riders?
That $67 million grant would buy, optimistically, maybe 6-7 barebones high level CR stations, probably more like 4 or 5.
Even with only around 500 riders per day, these GL stops see more passengers than a lot of CR stations, and most of the ones that aren't currently accessible are down towards the bottom for ridership.
One would hope that the T would create these new level boarding platforms to the Type-10 Spec, or at least plan it to be easily expanded in the near future... right?
Chestnut Hill Avenue/South Street and Fairbanks/Brandon Hall are to be consolidated, and Kent Street closed, as part of the station modifications. That will result in stop spacing averaging 1,200 feet on the C and 1,450 feet on the B. (The B will go up to 1,600 in the likely future scenario that Warren, Allston, and Griggs are reduced to 2, and 1,800 if the two BU stops are combined). I think that's pretty close to the ideal stop spacing on these lines - any wider, and riders lose more in walking time than they gain in speedier trains. These are fundamentally neighborhood routes that serve walk-up riders; there aren't major bus transfers at the terminals that mean ridership is weighted towards the ends of the lines.
Chestnut Hill Ave/South St seems like a bit of an odd choice if you're going to do one B branch project, the stop spacing there is already fine for the most part. Allston/Warren seems like it would make more sense, but it's not even mentioned as a future option. (Blandford/BU East is at least.) Not consolidating Englewood Ave/Dean Rd is also a bit odd, the shifted eastbound platform mean that at their closest they'll only be about 300ft apart. (Although when comparing EB platform to EB platform it's more like 800ft, which is still quite tight.)
This was mentioned at the bottom of the post I had made. The post mentions raising the off peak headway to the weekday headway. The 7 - 8 minute headway is only during rush hour when the Orange Line uses all trainsets that can be utilized. Middays, evenings, and weekends the T does not use all trainsets that can be used. While rush hour is important, running "meh" to "bad" headways outside of rush hour is, well, not great.
The Orange Line has been averaging 8 minute headways on weekdays since early April.
This isn’t peak headways, this is average weekday headways.
Pre-COVID, your criticism of the Orange Line having poor off-peak headways would have applied. Nowadays, the MBTA does a far better job of much more balanced all-day headways.
Your posts and response require very pointed follow-up questions:
1. Why are you presenting biased negative MBTA information when there are enough actual issues that we could be discussing those in good faith? You are using Saturday Orange Line headways here without stating so. You are not using midday weekday headways, and you are not using evening weekday headways, but rather Saturday headways, plain and simple. Why? If your issue is that Saturday headways are poor (this is a real problem), why not state that? We could be discussing reality instead of fiction. Why not come from a base of good faith?
2. Do you ride the Orange Line? I’m a very frequent Orange Line rider and the headways you describe are non-existent on weekdays on the Orange Line. Not at 6:00 am. Not at noon. Not at 6:00 pm. Not at midnight. The data backs that up. Use transitmatters’ dashboard if you don’t believe me. That’s where I get my data so that we can root ourselves in reality. The MBTA has long since switched to more consistent headways all-day on weekdays. Is it possible that I am mistakenly attributing malice here and you are operating on outdated assumptions that the Orange Line still has the ops of yesteryear?
Chestnut Hill Ave/South St seems like a bit of an odd choice if you're going to do one B branch project, the stop spacing there is already fine for the most part. Allston/Warren seems like it would make more sense, but it's not even mentioned as a future option. (Blandford/BU East is at least.) Not consolidating Englewood Ave/Dean Rd is also a bit odd, the shifted eastbound platform mean that at their closest they'll only be about 300ft apart. (Although when comparing EB platform to EB platform it's more like 800ft, which is still quite tight.)
I agree that axing South Street is a bit odd. Even with CHA flipped to the west side of the intersection, it's still a 900 foot walk from South Street at the closest point.
This project doesn't seem to be touching the Warren/Allston/Griggs trio. I'm not sure if it's because they weren't touched by the 2018 platform edge work that set off the accessibility requirement, or if it's because of the odd offset transit median. Either way, I'm sure those will happen down the road.
Dean Road comes up a lot in these discussions, but I don't see a need to remove it. Because it's the third-to-last stop, it effectively only delays riders from Englewood and Cleveland Circle. Again, that's probably a time where Dean Road riders lose more in walking time than Englewood/Cleveland Circle riders gain in speedier trains.
But Dean Rd users can immediately gain that time back by going to Beaconsfield. With Cleveland Circle being shifted east of Ayr Rd the distance between CC and Englewood will be less than 500ft. May as well take the opportunity to consolidate the two stops. Besides, if we want good stations it's cheaper to build one than two. If some people need to walk <2 minutes further I think that's a reasonable sacrifice.
Chestnut Hill Ave/South St seems like a bit of an odd choice if you're going to do one B branch project, the stop spacing there is already fine for the most part. Allston/Warren seems like it would make more sense, but it's not even mentioned as a future option. (Blandford/BU East is at least.) Not consolidating Englewood Ave/Dean Rd is also a bit odd, the shifted eastbound platform mean that at their closest they'll only be about 300ft apart. (Although when comparing EB platform to EB platform it's more like 800ft, which is still quite tight.)
Someone who knows more than me can try to find newer ridership numbers, but as of the 2014 Bluebook: South Street has the worst ridership on the B Line by far, with only 214 riders per day. The next worst was Chiswick Rd at 615, and then Chestnut Hill Ave at 626.
South Street's ridership potential is pretty terrible - aside from the immediately adjacent buildings on Comm Ave, it's basically only the south end of Foster Street that gets all that much of an additional walk. A lake to the south and a cemetery and open fields to the west don't exactly spell ridership potential to me. While it is inconvenient for those riders, in terms of a "fewest people impacted" perspective it seems high on the list.
BU would become the busiest stop on the entire surface system if they were combined, which would raise some questions to me as to if you actually get any operational improvements out of it or if you just wind up with longer dwell times + more platform crowding issues, especially with the (from my impression) somewhat peaky nature of college student ridership.
But Dean Rd users can immediately gain that time back by going to Beaconsfield. With Cleveland Circle being shifted east of Ayr Rd the distance between CC and Englewood will be less than 500ft. May as well take the opportunity to consolidate the two stops. Besides, if we want good stations it's cheaper to build one than two. If some people need to walk <2 minutes further I think that's a reasonable sacrifice.
My suspicion is that most riders taking the C at Dean Rd are not heading downtown, because they'll probably use the D otherwise. Rather, they're heading to local destinations along Beacon St, such as Coolidge Corner.
Dean Road and Beaconsfield are not exact substitutes any more than Cleveland Circle and Reservoir are. They're 1,000 feet (4 minutes) of walking apart, and (as Teban notes) Beaconsfield does not serve trips to destinations along Beacon Street. Ayr Road to Washington Street is ~3,700 feet; an average spacing of 925 feet is perfectly reasonable for this situation: stops in a dense residential area near the end of a fairly short line. To the riders that use them, the stop spacing is a feature not a bug - and because they're at the end of the line, they don't hurt anyone else.
The 2014 Blue Book is the easiest to reference quickly:
My read of the 2018 data (which should be taken with a grain of salt) puts the northside a little above 21K (against a system total of 63.5K), and the B just below 21K.
So, not quite more than the northside, but the B Line is definitely in the same ballpark as the entire northside.