You are using an out of date browser. It may not display this or other websites correctly.
You should upgrade or use an alternative browser.
You should upgrade or use an alternative browser.
General MBTA Topics (Multi Modal, Budget, MassDOT)
- Thread starter Waldorf
- Start date
millerm277
Active Member
- Joined
- Jun 25, 2013
- Messages
- 594
- Reaction score
- 824
Looks like they've got two customers already waiting in line.I don't know how long the sign has been up for, but I'm glad the T finally realized they have a prime location for a little coffee shop in Davis!
bigpicture7
Senior Member
- Joined
- May 5, 2016
- Messages
- 4,139
- Reaction score
- 10,974
Yeah, but apparently they didn't see the "no public restrooms" signLooks like they've got two customers already waiting in line.

themissinglink
Senior Member
- Joined
- Jan 13, 2018
- Messages
- 2,245
- Reaction score
- 6,464

The Red Line caused major morning delays Monday. Here’s what happened
Red Line riders were seeing delays of about 30 minutes on Monday morning, T officials said.
 www.masslive.com
The T first shared around 7 a.m. that a disabled train near Braintree station was causing delays of about 25 minutes. Delays continued through the morning, with officials saying on social media around 8:30 that another train was disabled at JFK/UMass station and that trains may stand by at stations.
At 9:05 a.m., the MBTA posted that another disabled train at Braintree was continuing to cause trains to stand by, and at 9:19, officials posted that multiple disabled trains were being removed from service and riders on the Braintree branch of the Red Line could expect delays of about 30 minutes.
themissinglink
Senior Member
- Joined
- Jan 13, 2018
- Messages
- 2,245
- Reaction score
- 6,464

MBTA sees strongest ridership numbers since pandemic
The MBTA is seeing its best ridership numbers since the pandemic, and its leadership is crediting increased service for the boost.
 www.bostonherald.com
“I’m proud to say, last month, October of ’25, is our highest ridership across all of our systems since pre-COVID days,” Massachusetts Bay Transportation Authority CEO and General Manager Phillip Eng said at the authority’s November board meeting.
In October, weekday ridership averaged 938,000 across all of the MBTA’s modes, which include subway, bus, commuter rail, ferry, and paratransit service for people with disabilities.
While ridership isn’t back to the levels it reached before the COVID shutdowns began — October 2019 saw about 1.29 million riders on average every weekday — service has been steadily improving back to pre-pandemic levels.
Heavy rail service on the Red, Orange, and Blue Lines in particular has improved significantly over the last year, according to data published by the MBTA, with the number of scheduled weekday trips up 55%, 50%, and 16% respectively from Spring 2024.
[...]
Allen-Connelly pointed to the Green Line as an area of further improvement, which had one percent fewer average daily trips and a 12% decline in ridership in October 2025, compared to the same time last year.
The MBTA is working to improve reliability and safety on the Green Line, shutting down large sections of the B, C, D, and E branches from Dec. 8 to Dec. 22 to perform improvements.

cubbe8
Active Member
- Joined
- Mar 18, 2022
- Messages
- 436
- Reaction score
- 782
themissinglink
Senior Member
- Joined
- Jan 13, 2018
- Messages
- 2,245
- Reaction score
- 6,464
Oh my god

Man injured after stepping off stopped Orange Line train near Roxbury Crossing - The Boston Globe
Authorities are currently unsure why the train halted at that location and how a door opened, allowing the man to exit.
 www.bostonglobe.com
Last edited:

Delvin4519
Active Member
- Joined
- Oct 8, 2022
- Messages
- 941
- Reaction score
- 1,639
Winter 2026 GTFS schedules are out.GTFS for Fall 2025 is out:
Winter 2026 Service Changes | Previous Service Changes | MBTA
Official website of the MBTA -- schedules, maps, and fare information for Greater Boston's public transportation system, including subway, commuter rail, bus routes, and boat lines.
 www.mbta.com
Winter 2026 Service Updates Announced | News | MBTA
Official website of the MBTA -- schedules, maps, and fare information for Greater Boston's public transportation system, including subway, commuter rail, bus routes, and boat lines.
www.mbta.com
Here's what's new:
Frequency decreases:
* Green Line B, C, D - weekday service cut
* Green Line E - weekday and Saturday service cut
* Red Line - weekday service cut
* Bus routes: SL2, 17, 34, 100, 112, 238
Frequency decreases and increases:
* Bus routes: SLW, 39, 134
Frequency increases:
* Orange Line on weekdays only
* Bus routes: SL1, SL3, ,7, 9, 21, 22, 26, 32, 45, 57, 64, 66, 69, 71, 73, 77, 83, 110, 116, 215, 225, 240, 245, 426, 429, 716
* Fairmount Line
Overall:
* Weekday overall aggregated subway service now decreases below pre-COVID weekday service levels due to Green Line and Red Line weekday service cuts. The OL service increase is not enough to offset the decrease.
* Saturday MBTA overall service levels and bus service levels have finally returned to their pre-COVID levels, reaching 100% for the first time.
* Weekday bus service levels remain in the upper 80s% of pre-COVID levels, still below 90%. It's now 88.5% instead of 87.0% of pre-COVID levels. Still barely a dent at all.

* Tthe MBTA finally undid like 75-80% of those summer 2023 service cuts. Still like 20% left of those 2023 service cuts to undo.
And for each individual changed route:
Updated MBTA frequency map changes (now updated to winter 2026 new schedules):
* Moved Fairmount Line form "Every 2 hours or less frequent" to Every 1 - 2 hours" now exceeding 11 Sunday trips
* Moved routes 9 from "Every 30 - 60 minutes" to "Every 20 - 30 minutes" now exceeding 41 Sunday trips (frequency is derived from the weekday evening frequency)
* Moved routes 21 and 69 from "Every 30 - 60 minutes" to "Every 20 - 30 minutes" now exceeding 41 Sunday trips
* Moved routes 22, 39, 57, and 66 from "Every 15 - 20 minutes" to "Every 12 - 15 minutes" now exceeding 81 Sunday trips
* Moved route 32 from "Every 12 - 15 minutes" to "Every 10 - 12 minutes" now exceeding 101 Sunday trips
* Routes 34/34E trunk adjusted to reflect coordinated trips on Sunday, shifting from "Every 20 - 30 minutes" to "Every 15 - 20 minutes" on Washington St, and from "Every 15 - 20 minutes" to "Every 12 - 15 minutes" between Forest Hills and Roslindale Square.
* Moved route 64 from "Every 2 hours or less frequent" to "Every 30 - 60 minutes" now exceeding 11/21 Sunday trips
* Moved routes 71 and 73 from "Every 20 - 30 minutes" to "Every 15 - 20 minutes" now exceeding 61 Sunday trips but not 81. (Core trunk shifts from "Every 10 - 12 minutes" to "10 minutes or better")
* Moved route 83 from "Every 1 - 2 hours" to "Every 30 - 60 minutes" now exceeding 21 Sunday trips
* Extended every 1-2 hour Sunday service to cover all of the Lebanon Loop due to route 106 extension
* Extended every 1-2 hour Sunday service from West Medford to Woburn Square due to route 134 extension
Old maps: Pre-COVID; 2023: Winter, Spring (Slow Zones), Summer, Fall; 2024: Winter, Spring, Summer (News), Fall; 2025: Winter, Spring, Summer, Fall
Last edited:
I wonder how much of the 77 line in your list is actually the 77A trips (that never really served many passengers).Winter 2026 GTFS schedules are out.
Winter 2026 Service Changes | Previous Service Changes | MBTA
Official website of the MBTA -- schedules, maps, and fare information for Greater Boston's public transportation system, including subway, commuter rail, bus routes, and boat lines.Winter 2026 Service Updates Announced | News | MBTA
Official website of the MBTA -- schedules, maps, and fare information for Greater Boston's public transportation system, including subway, commuter rail, bus routes, and boat lines.
Here's what's new:
Frequency decreases:
* Green Line B, C, D - weekday service cut
* Green Line E - weekday and Saturday service cut
* Red Line - weekday service cut
* Bus routes: SL2, 17, 34, 100, 112, 238
Frequency decreases and increases:
* Bus routes: SLW, 39, 134
Frequency increases:
* Orange Line on weekdays only
* Bus routes: SL1, SL3, ,7, 9, 21, 22, 26, 32, 45, 57, 64, 66, 69, 71, 73, 77, 83, 110, 116, 215, 225, 240, 245, 426, 429, 716
* Fairmount Line
Overall:
* Weekday overall aggregated subway service now decreases below pre-COVID weekday service levels due to Green Line and Red Line weekday service cuts. The OL service increase is not enough to offset the decrease.
* Saturday MBTA overall service levels and bus service levels have finally returned to their pre-COVID levels, reaching 100% for the first time.
* Weekday bus service levels remain in the upper 80s% of pre-COVID levels, still below 90%. It's now 88.5% instead of 87.0% of pre-COVID levels. Still barely a dent at all.
* Tthe MBTA finally undid like 75-80% of those summer 2023 service cuts. Still like 20% left of those 2023 service cuts to undo.
View attachment 69143
And for each individual changed route:
View attachment 69142
Updated MBTA frequency map changes (now updated to winter 2026 new schedules):
* Moved Fairmount Line form "Every 2 hours or less frequent" to Every 1 - 2 hours" now exceeding 11 Sunday trips
* Moved routes 9 from "Every 30 - 60 minutes" to "Every 20 - 30 minutes" now exceeding 41 Sunday trips (frequency is derived from the weekday evening frequency)
* Moved routes 21 and 69 from "Every 30 - 60 minutes" to "Every 20 - 30 minutes" now exceeding 41 Sunday trips
* Moved routes 22, 39, 57, and 66 from "Every 15 - 20 minutes" to "Every 12 - 15 minutes" now exceeding 81 Sunday trips
* Moved route 32 from "Every 12 - 15 minutes" to "Every 10 - 12 minutes" now exceeding 101 Sunday trips
* Routes 34/34E trunk adjusted to reflect coordinated trips on Sunday, shifting from "Every 20 - 30 minutes" to "Every 15 - 20 minutes" on Washington St, and from "Every 15 - 20 minutes" to "Every 12 - 15 minutes" between Forest Hills and Roslindale Square.
* Moved route 64 from "Every 2 hours or less frequent" to "Every 30 - 60 minutes" now exceeding 11/21 Sunday trips
* Moved routes 71 and 73 from "Every 20 - 30 minutes" to "Every 15 - 20 minutes" now exceeding 61 Sunday trips but not 81. (Core trunk shifts from "Every 10 - 12 minutes" to "10 minutes or better")
* Moved route 83 from "Every 1 - 2 hours" to "Every 30 - 60 minutes" now exceeding 21 Sunday trips
* Extended every 1-2 hour Sunday service to cover all of the Lebanon Loop due to route 106 extension
* Extended every 1-2 hour Sunday service from West Medford to Woburn Square due to route 134 extension
View attachment 69144
Old maps: Pre-COVID; 2023: Winter, Spring (Slow Zones), Summer, Fall; 2024: Winter, Spring, Summer (News), Fall; 2025: Winter, Spring, Summer, Fall
Delvin4519
Active Member
- Joined
- Oct 8, 2022
- Messages
- 941
- Reaction score
- 1,639
TransitMatters also seems to be including the 77A in its service calculations. Using TM's recovery dashboard I estimate about 19 weekday trips/direction ish, or 95 trips/week that may have been 77A trips pre-COVID.I wonder how much of the 77 line in your list is actually the 77A trips (that never really served many passengers).
My tracker puts the T's weekday bus service metric at 88.5% of pre-COVID levels for winter 2026. If you want to remove 77A trips, that puts you at 89.7% systemwide on average. I suppose it's a shift. Maybe at 98.6% at systemwide weekday bus service levels we'll be at pre-COVID levels, I guess. If you want to "technically" remove those 77A trips.
I'm just going to keep the methodology aligned with TransitMatters for the sake of keeping my data comparable with TM (for my own purposes); so if you want my charts to discard them, then I'll adjust the baseline use on my end, if TransitMatters gets around to adjusting theirs. I'm not in the mood of removing 77A trips if TransitMatters isn't gonna remove the 77A trips from their end.
Last edited:
My experience is that the 77A trips weren't really that well utilized - Cambridge and the northwest seems to have continually got the short end of the provierbial stick for previous bus service planning. The 77A and CT1 being promising but, in actuality, undersupported initiatives. Even the CT2, when it was my regular commute route, was severely under resourced. That being said, understand where the data comes from. I still don't think either you or TM (who probably don't have such a close-to-ground understanding of that route) should include it in the counts as it was equally likely to not run, despite being on some schedules at times.

TheRatmeister
Senior Member
- Joined
- Sep 23, 2023
- Messages
- 1,644
- Reaction score
- 3,382
77A wasn't a poorly thought out initiative of the MBTA era, it was a leftover from the BERy era that was as good as dead the minute the Red Line opened to Davis in 1984. I'm surprised it lasted as far as it did, making it to 1998 before being mostly axed and to 2005 before being (almost) fully axed.My experience is that the 77A trips weren't really that well utilized - Cambridge and the northwest seems to have continually got the short end of the provierbial stick for previous bus service planning. The 77A and CT1 being promising but, in actuality, undersupported initiatives. Even the CT2, when it was my regular commute route, was severely under resourced. That being said, understand where the data comes from. I still don't think either you or TM (who probably don't have such a close-to-ground understanding of that route) should include it in the counts as it was equally likely to not run, despite being on some schedules at times.
I get wanting to keep your data aligned with TM, that's a reasonable decision, but...My tracker puts the T's weekday bus service metric at 88.5% of pre-COVID levels for winter 2026. If you want to remove 77A trips, that puts you at 89.7% systemwide on average. I suppose it's a shift. Maybe at 98.6% at systemwide weekday bus service levels we'll be at pre-COVID levels, I guess. If you want to "technically" remove those 77A trips.
I'm just going to keep the methodology aligned with TransitMatters for the sake of keeping my data comparable with TM (for my own purposes); so if you want my charts to discard them, then I'll adjust the baseline use on my end, if TransitMatters gets around to adjusting theirs. I'm not in the mood of removing 77A trips if TransitMatters isn't gonna remove the 77A trips from their end.
All 77A trips after 2005 were depot-moves in all but name. The route was not listed on the system map, it didn't have a schedule page on mbta.com (that I can find, anyway), and it isn't even logged in the 'Bus Ridership by Trip' datasets. If the MBTA is comfortable enough pretending it never existed after 2005, I think I am too.
Delvin4519
Active Member
- Joined
- Oct 8, 2022
- Messages
- 941
- Reaction score
- 1,639
That what makes it tricky for both my data and TM data to filter out 77A trips from regular 77 trips. The 77A trips are not listed separately where there's an easy clear flag to filter them out.All 77A trips after 2005 were depot-moves in all but name. The route was not listed on the system map, it didn't have a schedule page on mbta.com (that I can find, anyway), and it isn't even logged in the 'Bus Ridership by Trip' datasets. If the MBTA is comfortable enough pretending it never existed after 2005, I think I am too.
Meanwhile, the 57A was listed separately prior to spring 2019, and TransitMatters, funnily enough, forgot to include 57A data in its data dashboard for trips prior to spring 2019 (August 2018 - April 2019 is missing 57A trip data in the TM dashboard).
Delvin, I know I am returning to a topic that has already been discussed, but I think it merits revisiting: your numbers present (very) small reductions in trip count on the Red Line and Green Line, but they do not depict a frequency cut, at least not by any practical definition.Winter 2026 GTFS schedules are out.
...
Frequency decreases:
* Green Line B, C, D - weekday service cut
* Green Line E - weekday and Saturday service cut
* Red Line - weekday service cut
* Bus routes: SL2, 17, 34, 100, 112, 238
....
And for each individual changed route:
View attachment 69142
Take the Ashmont Branch. Fall '25 had 113 Sunday trips, while Winter '26 will have 112 Sunday trips, over 19.5 hours of service. Doing out the math:
- 113 trains / 19.5 hours = 5.79 tph
- 10m22s headways
- 112 trains /19.5 hours = 5.74 tph
- 10m27s headways
It is technically correct to describe that as a decrease in average frequencies. However, that conclusion does not take into account:
- the T does not have strong enough headway maintenance for a five second difference to matter
- trip count does not directly correlate to schedules;
- it would be pretty doable to, in fact, increase frequencies during morning, midday, and evening, while decreasing frequencies for a handful of trips at late night
People do lurk on these boards -- they read your analysis, and doubtless are impressed by your depth and attention to detail, and many of them probably trust your top-line conclusions without delving (no pun intended) into the data themselves. I think that audience would feel misled by your statement that the T is implementing frequency cuts on the Red and Green Lines. It is a technically true statement that doesn't consider important context, and I think most readers would disagree with that statement if given that context.
I know this is a topic you care deeply about, so I hope you will consider reframing your conclusions in light of the concerns raised here. I think doing so will benefit your cause.

The EGE
Senior Member
- Joined
- Jun 29, 2013
- Messages
- 1,930
- Reaction score
- 5,369
December 2025 accessibility update is out. The big news is that the MBTA is in substantial compliance with the 2006 Daniels-Finegold settlement agreement (presumably this is to be certified at Wednesday's meeting). Individual project updates:
- Additional crossovers on the D Branch, which will supporting single-tracking for the Newton Highlands reconstruction, are delayed from 2026 to late 2027. I presume this is as a result of the other track work that has been done the last few years.
- Full reconstruction of Waban, Eliot, Chestnut Hill and Beaconsfield, previously expected to begin in 2026, no longer has a date given
- B Branch station reconstructions still expected to begin in the spring, but completion delayed slightly to late 2027
- C Branch station reconstructions to begin in the spring (previously expected this fall), but still to be complete by late 2026
- E Branch station reconstructions have reached 30% design. Schedule is the same as before: 100% design in late 2026, construction in 2027-2029
- Symphony station is expected to be closed in March 2026 for reconstruction. Completion delayed from late 2028 to fall 2029.
- The west half of Natick Center station is supposed to be complete by... November 2025? I don't think that happened. (The east half did open in July, making the station accessible.)
- Another already-out-of-date item: Newtonville expected to have notice to proceed by October 2025. In reality, there's a meeting this week with more information, and the website currently says construction in the spring.
- Work at Worcester Union Station was substantially completed in September.
- Contract negotiations underway with the designer for the new Lynn station
- In the last update, the MBTA was looking at conceptual designs for 400-foot and 800-foot platforms for Waverley. They managed to produce designs with 200- and 400-foot platforms, with costs ranging from $62M to $76M. Some of which don't even have elevators! I'm baffled how you can possibly spend that much for tiny platforms.
- Notice to proceed for DTX elevators was issued in September. It will add elevators connecting Red Line SB to both Orange Line platforms, and replace the Park Street center island elevator (that serves as the OL SB / RL NB elevator). It was bundled with Central Square, which is getting redundant elevators on both sides plus replacement of the northbound elevator.
- Procurement for bus stop/bus lane violation system is underway. Rollout in spring 2026, systemwide expansion "swiftly thereafter".
- New section for "capital projects on hold pending additional funding", which lists these items included in previous reports:
- Longfellow viaduct reconstruction, including modifications to Charles/MGH station
- Additional replacement and redundant elevators at a number of stations, which would include new/reopened entrances at Arlington, Chinatown, Mass Ave, and Broadway
- South Attleboro reconstruction
- Hynes reconstruction
Longfellow
Active Member
- Joined
- Dec 12, 2023
- Messages
- 458
- Reaction score
- 1,112
This is just pure robbery by consultants if it costs 70 million dollars to make this work. The T needs to root out the culture that we have to take these firms at their word...
The EGE
Senior Member
- Joined
- Jun 29, 2013
- Messages
- 1,930
- Reaction score
- 5,369
Part of it is a self-inflicted wound - it appears that internal policy insists on applying tunnel egress standards to non-tunnel stations, requires backup generators at every station, and other cost-bloating factors. But I fully agree - this is not a station that should be horrendously complicated. Even with the curve, there is nearly-tangent track in either direction with plenty of room for standard platforms.
TheRatmeister
Senior Member
- Joined
- Sep 23, 2023
- Messages
- 1,644
- Reaction score
- 3,382
There's nothing in the design guidelines that I can find that should restrict the current sites for both Belmont and Waverley, a 4º curve is allowed in stations.Part of it is a self-inflicted wound - it appears that internal policy insists on applying tunnel egress standards to non-tunnel stations, requires backup generators at every station, and other cost-bloating factors. But I fully agree - this is not a station that should be horrendously complicated. Even with the curve, there is nearly-tangent track in either direction with plenty of room for standard platforms.
cubbe8
Active Member
- Joined
- Mar 18, 2022
- Messages
- 436
- Reaction score
- 782
NTP was given to Consigli on December 1st. So a bit over one month off.
- Another already-out-of-date item: Newtonville expected to have notice to proceed by October 2025. In reality, there's a meeting this week with more information, and the website currently says construction in the spring.
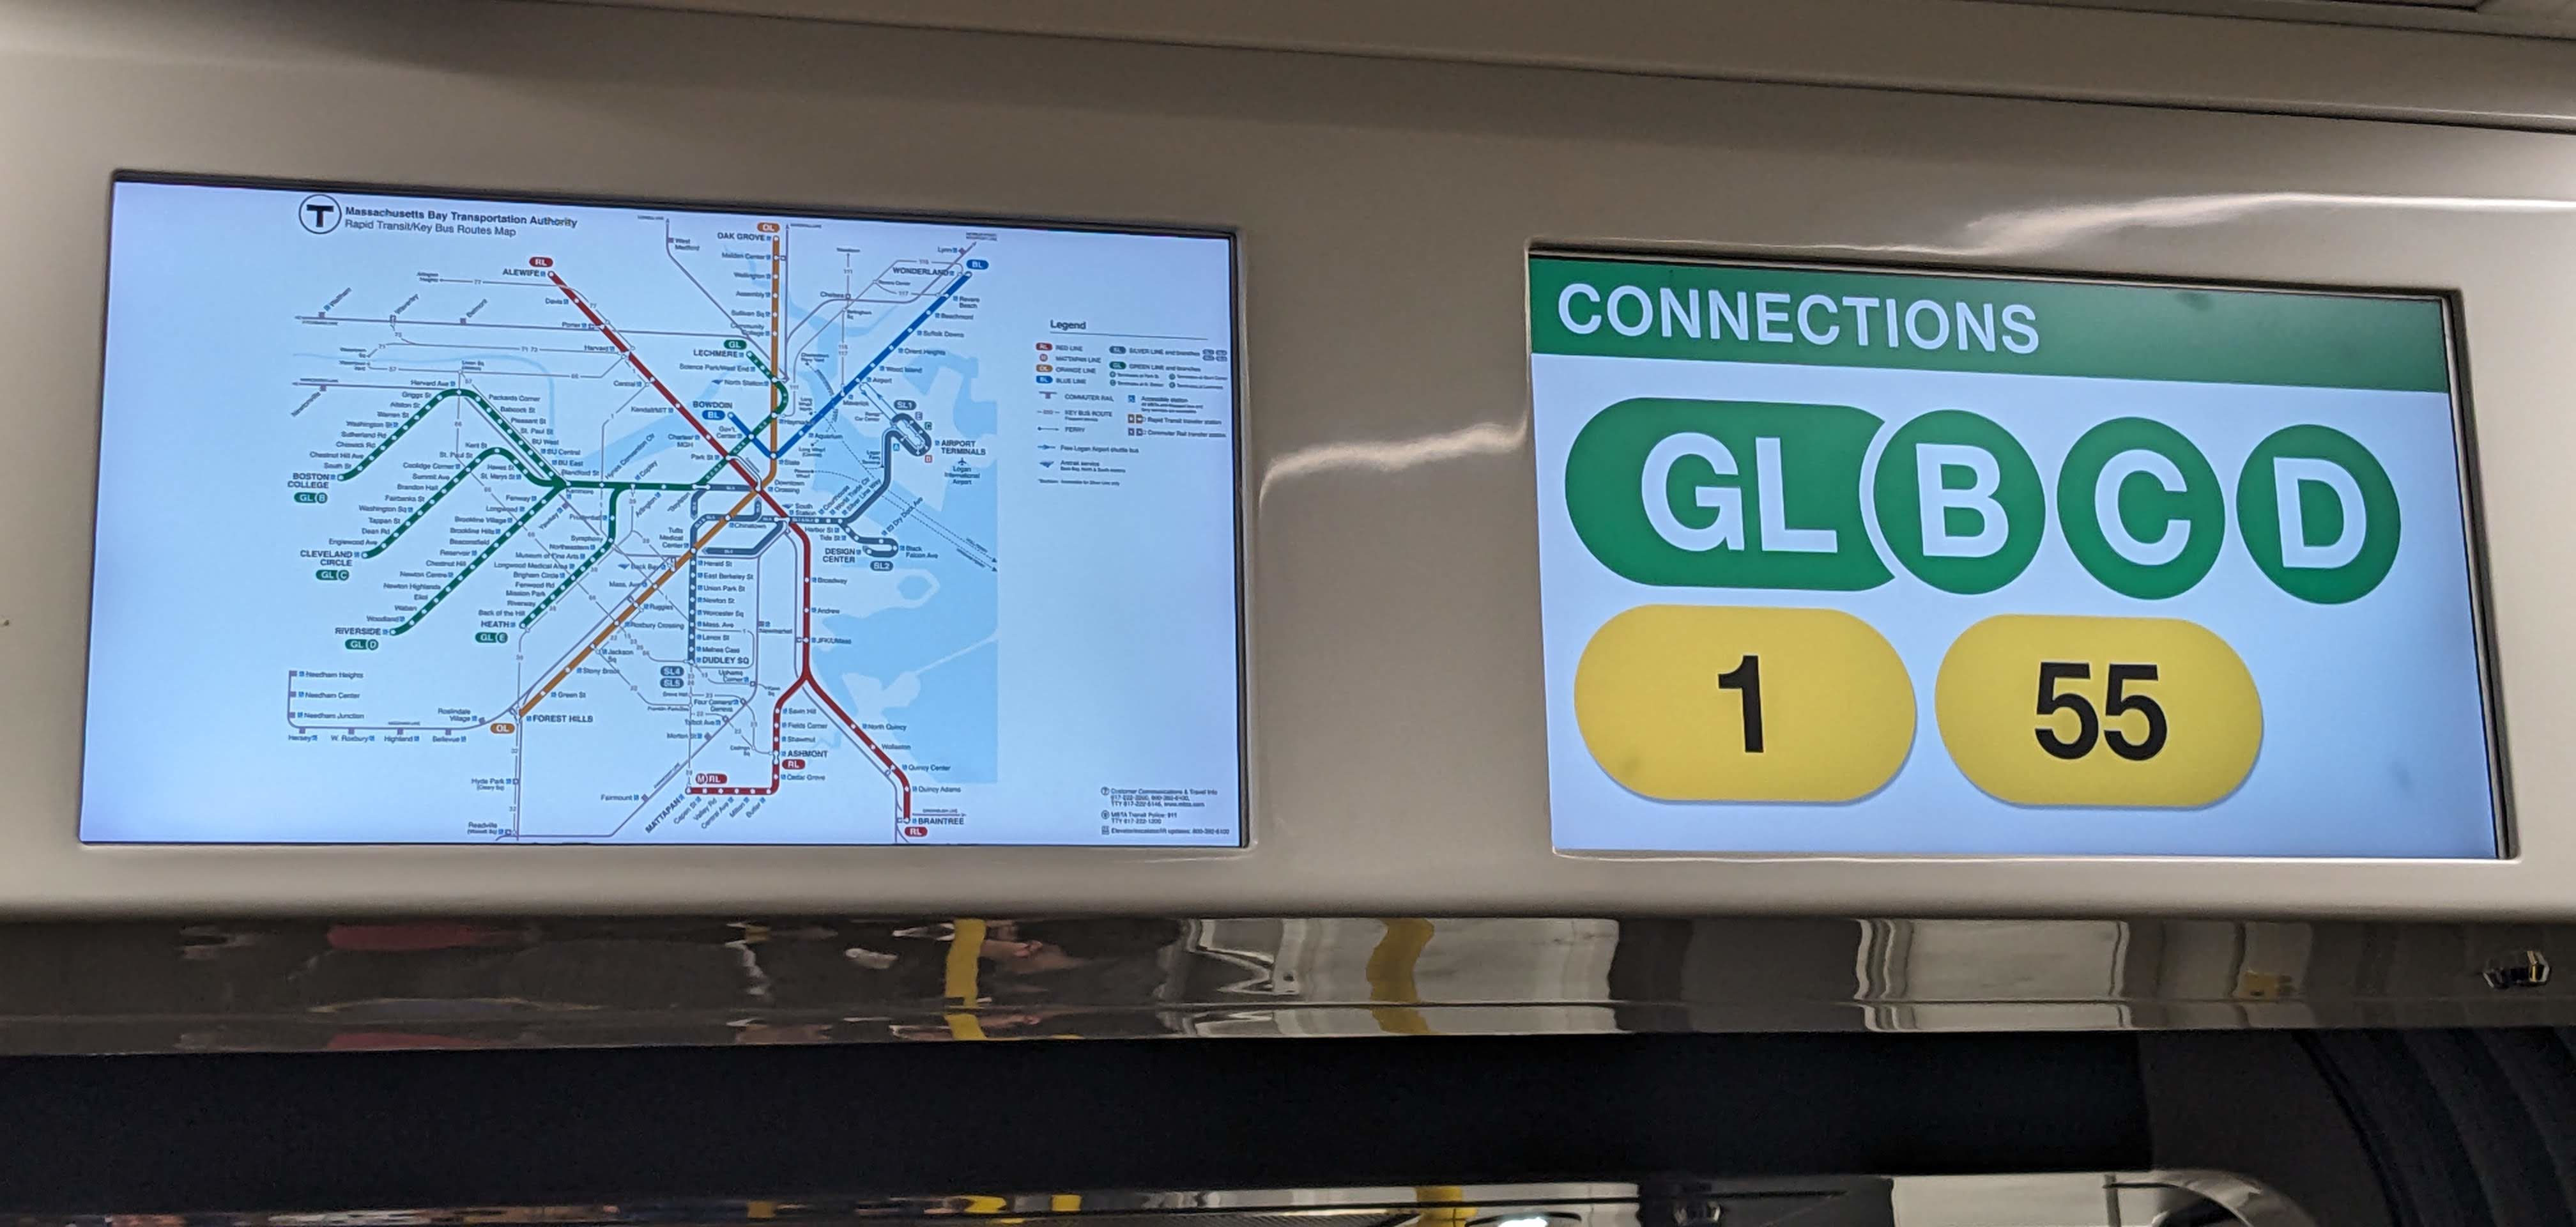
It took a long time after GLX for the T to update maps around the system. I don't see a lot of outdated maps anymore, so it was interesting to see this one. I would have thought part of the benefit of using a digital display is that it's easy to update, but I guess not.