Mosaic Boston Condos | 80-82 Fenwood Road | Longwood

The 30-35,000 is Marty's goal but to really make a difference in cost and not just hold thing where they are now it would have to be over 50,000.

Citylover -- I'm always very suspicious of these kinds of demand projections -- they all tend to suffer from single to multiple transformation syndrome

Back at the tail-end of the Dotcom / Telecom boom -- I was doing some work with a well funded, rapidly growing start-up in Cambridge [Central Square area]. I did some scoping -out of the real estate options for the company assuming that the head-count would double again in the next 6 months. So I called a number of commercial / industrial real estate brokers and asked about the availability of 100k sq ft. The company really needed about 60k but I was trying to see what might be gotten that would obviate the need for the 3rd move in 1.5 years.

Now I'm, sure that the developers all got calls from the brokers who wanted to see what was in the early stages of the pipeline. And this being the Mother of all Booms -- the publications all got wind. My inquiry ended-up as a part of the story on the boom in conversions of old commercial / industrial builidings into space for Dotcom / telecoms.

Of-course we all know that everything pretty much collapsed in the next 6 months and there was no real demand -- within 6 more months the remnants of the company slipped away into the murk of history.

Is there really a demand for 50,000 more units housing some 100k to 150k more people? in 15 years -- we can only go on the basis of the current rebound in Boston's population continuing. Yet a competing interest has published a report saying most of the new growth will bring in more cars [80k] -- that implies suburban growth -- are we double counting the same economic growth driving both city and suburban homes?

In 5 years when the 2020 Census has been processed we'll have a real data point to test our hypothesis against

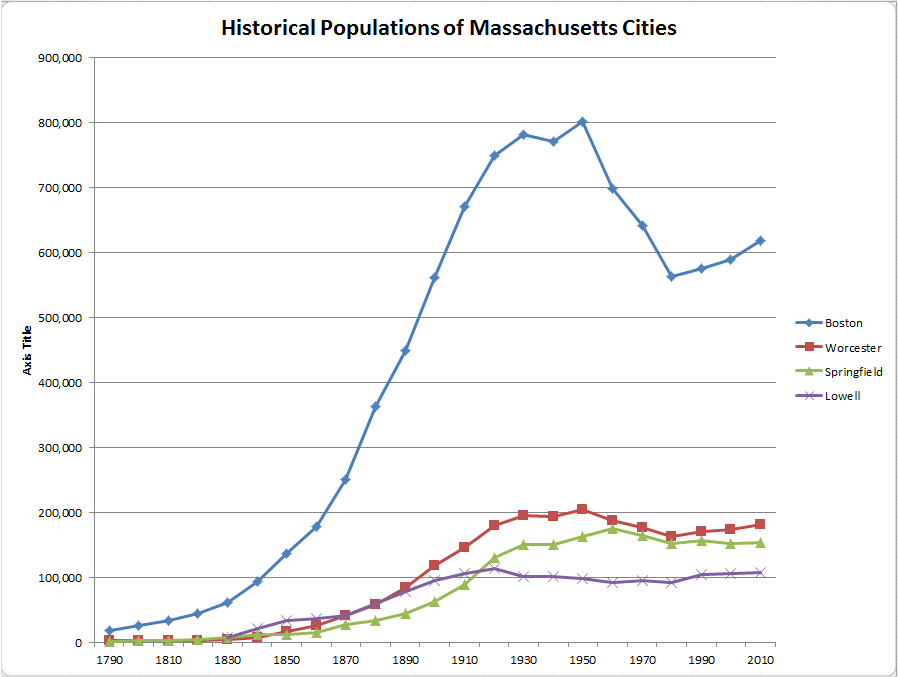
Here's the historic data for the period since WWII
1950 801,444 +4.0%
1960 697,197 −13.0%
1970 641,071 −8.1%
1980 562,994 −12.2%
1990 574,283 +2.0%
2000 589,141 +2.6%
2010 617,594 +4.8%
Est. 2015 667,137 +8.0%
 
i would love to see the number of population vs housing units in 1950 vs now.

i think there must have been a significant higher number of larger families crammed in tenements than now.
 
i would love to see the number of population vs housing units in 1950 vs now.

i think there must have been a significant higher number of larger families crammed in tenements than now.

I think more of it can be explained by children sharing bedrooms. That used to be much more common.
 
Is there really a demand for 50,000 more units housing some 100k to 150k more people? in 15 years -- we can only go on the basis of the current rebound in Boston's population continuing. Yet a competing interest has published a report saying most of the new growth will bring in more cars [80k] -- that implies suburban growth -- are we double counting the same economic growth driving both city and suburban homes?

From NextCity:
Boston and its 15 closest suburbs will take in 239,000 more people, the report forecasts — a 17.5 percent spike. Outer suburbs will see a 4 percent increase in population, but a 4 percent drop in the labor force, as baby boomers retire.
 

34f -- Not to belabor the point -- but:
  • does this entity issuing the report have a track record estimating Boston Area population
  • what is their quality of estimate

I've seen this before -- following an exponential is dangerous

I was a member of the City of Austin Electric Utility Commission when Austin was going from about 300k to about 450k -- at its peak growth in 1981 nearly 10% annual growth in demand for water, sewer and electricity

Of course all exponentials in the real world stop -- sometime rather abruptly as Austin went into a growth freeze from 1984 until about 1990. Austin subsequently resumed growing but the rate is substantially less although it passed Boston's city-limited population about 2000

QEOffdU-l3t47JVx64VaNQ4XGBA0cj41id0WAZFW2XKIjgwz9EcrbghXY6hu7EyMyuWVc2AUwY9s-TIrEmcS8NXtkIoFRT_d-GySP2C27z3Ya8OtzEFR_tmD30D3KA


In Contrast I don't think back in its Halcyon days -- when the Fins were really Big -- that anyone predictied what would happen to Detroit -- which Boston is poised to exceed in city-limits population
slide02.jpg


and unfortunately on a totally different time axis -- Boston and a couple other cities in the Globally Greater Boston

Populations1.PNG
 
Last edited:
i would love to see the number of population vs housing units in 1950 vs now.

i think there must have been a significant higher number of larger families crammed in tenements than now.

Odurandia -- there is a report -- in the form of a pdf
http://www.bostonredevelopmentauthority.org/getattachment/70ddddcd-760f-49fa-a32e-fb5a80becd34
so I can only post the text [housing units and people per unit graph is given on page 7]
Housing Units and Average Household Size
Source: US Census Bureau, American Community Survey, BRA Research Division Analysis
• Boston’s housing stock has grown consistently over the last 40 years
• Boston’s housing stock grew 8.2% since 2000

here's the units and people per unit as I copy them off the graph
  • 1950 222,079 3.39
  • 1960 238,695 2.95
  • 1970 232,401 2.77 -- smallest recent population
  • 1980 241,304 2.40
  • 1990 250,863 2.37
  • 2000 251,935 2.31
  • 2010 272,481 2.26

Looking at this data -- my quick view would be that families fled the city because of the crappy schools leaving behind DINKS
 
Odurandia -- there is a report -- in the form of a pdf
http://www.bostonredevelopmentauthority.org/getattachment/70ddddcd-760f-49fa-a32e-fb5a80becd34
.....

Looking at this data -- my quick view would be that families fled the city because of the crappy schools leaving behind DINKS

That's not a conclusion supported by national data on household size.

See:

http://www.census.gov/hhes/families/files/graphics/HH-6.pdf

Where average household size has dropped from about 3.7 individuals in 1940 to about 2.5 in 2015.
 
Check out page 7 of this presentation to see the trend.

Odurandia -- there is a report -- in the form of a pdf
http://www.bostonredevelopmentauthority.org/getattachment/70ddddcd-760f-49fa-a32e-fb5a80becd34
so I can only post the text [housing units and people per unit graph is given on page 7]

here's the units and people per unit as I copy them off the graph
  • 1950 222,079 3.39
  • 1960 238,695 2.95
  • 1970 232,401 2.77 -- smallest recent population
  • 1980 241,304 2.40
  • 1990 250,863 2.37
  • 2000 251,935 2.31
  • 2010 272,481 2.26

Looking at this data -- my quick view would be that families fled the city because of the crappy schools leaving behind DINKS


Thanks. :)
 
Last edited:
Did we ever find out what the name 'Mosaic' is in reference to?

Yeah, it did come out nice. I'd take at least 30 more of these dotted around the city next to or on top of T stations.
 
This feels like a really well executed project. It may not be the flashiest building and it has alot of the same design elements many other projects have had in the last 2-3 years but it does it better than the rest of them.
 
Agreed, this is really well done, in a prominent "gateway" location.

Every time I roll past this project, it reminds me of how spellbindingly awful Avenir, The Victor, and The Merano are by comparison -- another gateway location that looks carelessly generic. Thanks, Tom Menino!
 
Why all the fencing around this building or was the fencing already in place before Mosaic went up?
 

Back
Top